# Lighthouse
> 
---
# Source: https://github.com/GoogleChrome/lighthouse/blob/main/docs/architecture.md
# Architecture
_Some incomplete notes_

## Components & Terminology
* **Driver** - Interfaces with [Puppeteer](https://github.com/puppeteer/puppeteer) and [Chrome Debugging Protocol](https://developer.chrome.com/devtools/docs/debugger-protocol) ([API viewer](https://chromedevtools.github.io/debugger-protocol-viewer/))
* **Gatherers** - Uses Driver to collect information about the page. Minimal post-processing. Run Lighthouse with `--gather-mode` to see the 3 primary outputs from gathering:
1. `artifacts.json`: The output from all [gatherers](../core/gather/gatherers).
2. `trace.json`: Most performance characteristics come from here. You can view it in the DevTools Peformance panel.
3. `devtoolslog.json`: A log of all the [DevTools Protocol](https://chromedevtools.github.io/devtools-protocol/) events. Primary signal about network requests and page state.
* **Audit** - The [audits](../core/audits) are tests for a single feature/optimization/metric. Using the Artifacts as input, an audit evaluates a test and resolves to a numeric score. See [Understanding Results](./understanding-results.md) for details of the LHR (Lighthouse Result object).
* **Computed Artifacts** - [Generated](../core/computed) on-demand from artifacts, these add additional meaning, and are often shared amongst multiple audits.
* **Report** - The report UI, created client-side from the LHR. See [HTML Report Generation Overview](../report/README.md) for details.
### Audit/Report terminology
* **Category** - Roll-up collection of audits and audit groups into a user-facing section of the report (eg. `Best Practices`). Applies weighting and overall scoring to the section. Examples: Accessibility, Best Practices.
* **Audit title** - Short user-visible title for the successful audit. eg. “All image elements have `[alt]` attributes.”
* **Audit failureTitle** - Short user-visible title for a failing audit. eg. “Some image elements do not have `[alt]` attributes.”
* **Audit description** - Explanation of why the user should care about the audit. Not necessarily how to fix it, unless there is no external link that explains it. ([See description guidelines](../CONTRIBUTING.md#audit-description-guidelines)). eg. “Informative elements should aim for short, descriptive alternate text. Decorative elements can be ignored with an empty alt attribute. [Learn more].”
## Protocol
* _Interacting with Chrome:_ The Chrome protocol connection maintained via [WebSocket](https://github.com/websockets/ws) for the CLI [`chrome.debuggger` API](https://developer.chrome.com/extensions/debugger) when in the Chrome extension.
* _Event binding & domains_: Some domains must be `enable()`d so they issue events. Once enabled, they flush any events that represent state. As such, network events will only issue after the domain is enabled. All the protocol agents resolve their `Domain.enable()` callback _after_ they have flushed any pending events. See example:
```js
// will NOT work
driver.defaultSession.sendCommand('Security.enable').then(_ => {
driver.defaultSession.on('Security.securityStateChanged', state => { /* ... */ });
})
// WILL work! happy happy. :)
driver.defaultSession.on('Security.securityStateChanged', state => { /* ... */ }); // event binding is synchronous
driver.defaultSession.sendCommand('Security.enable');
```
* _Debugging the protocol_: Read [Better debugging of the Protocol](https://github.com/GoogleChrome/lighthouse/issues/184).
## Understanding a Trace
`core/lib/tracehouse/trace-processor.js` provides the core transformation of a trace into more meaningful objects. Each raw trace event has a monotonically increasing timestamp in microseconds, a thread ID, a process ID, a duration in microseconds (potentially), and other applicable metadata properties such as the event type, the task name, the frame, etc. [Learn more about trace events](https://docs.google.com/document/d/1CvAClvFfyA5R-PhYUmn5OOQtYMH4h6I0nSsKchNAySU/preview).
### Example Trace Event
```js
{
'pid': 41904, // process ID
'tid': 1295, // thread ID
'ts': 1676836141, // timestamp in microseconds
'ph': 'X', // trace event type
'cat': 'toplevel', // trace category from which this event came
'name': 'MessageLoop::RunTask', // relatively human-readable description of the trace event
'dur': 64, // duration of the task in microseconds
'args': {}, // contains additional data such as frame when applicable
}
```
### Processed trace
The processed trace identifies trace events for key moments (navigation start, FCP, LCP, DOM content loaded, trace end, etc) and provides filtered views of just the main process and the main thread events. Because the timestamps are not necessarily interesting in isolation, the processed trace also calculates the times in milliseconds of key moments relative to navigation start, thus providing the typical interpretation of metrics in ms.
```js
{
processEvents: [/* all trace events in the main process */],
mainThreadEvents: [/* all trace events on the main thread */],
timings: {
timeOrigin: 0, // timeOrigin is always 0 ms
firstContentfulPaint: 150, // firstContentfulPaint time in ms after time origin
/* other key moments */
traceEnd: 16420, // traceEnd time in ms after time origin
},
timestamps: {
timeOrigin: 623000000, // timeOrigin timestamp in microseconds, marks the start of the navigation of interest
firstContentfulPaint: 623150000, // firstContentfulPaint timestamp in microseconds
/* other key moments */
traceEnd: 639420000, // traceEnd timestamp in microseconds
},
}
```
## Audits
The return value of each audit [takes this shape](https://github.com/GoogleChrome/lighthouse/blob/17b7163486b69239689ed49415bdeee6f7766bfa/types/audit.d.ts#L66-L83).
The `details` object is parsed in report-renderer.js. View other audits for guidance on how to structure `details`.
## Core internal module dependencies

(Generated May 17, 2022 via `madge core/index.js --image arch.png --layout dot --exclude="(locales\/)|(stack-packs\/packs)"`)
## Lantern
[Lantern](./lantern.md) is how Lighthouse simulates network and cpu throttling.
---
# Source: https://github.com/GoogleChrome/lighthouse/blob/main/docs/authenticated-pages.md
# Running Lighthouse on Authenticated Pages
Default runs of Lighthouse load a page as a "new user", with no previous session or storage data. This means that pages requiring authenticated access do not work without additional setup. You have a few options for running Lighthouse on pages behind a login:
## Option 1: Script the login with Puppeteer
[Puppeteer](https://pptr.dev) is the most flexible approach for running Lighthouse on pages requiring authentication.
See [a working demo at /docs/recipes/auth](./recipes/auth).
View our full documentation for using [Lighthouse along with Puppeteer](https://github.com/GoogleChrome/lighthouse/blob/main/docs/puppeteer.md).
## Option 2: Leverage logged-in state with Chrome DevTools
The Lighthouse panel in Chrome DevTools will never clear your cookies, so you can log in to the target site and then run Lighthouse. If `localStorage` or `indexedDB` is important for your authentication purposes, be sure to uncheck `Clear storage`.
## Option 3: Pass custom request headers with Lighthouse CLI
CLI:
```sh
lighthouse http://www.example.com --view --extra-headers="{\"Authorization\":\"...\"}"
```
Node:
```js
const result = await lighthouse('http://www.example.com', {
extraHeaders: {
Authorization: '...',
},
});
```
You could also set the `Cookie` header, but beware: it will [override any other Cookies you expect to be there](https://github.com/GoogleChrome/lighthouse/pull/9170). For a more flexible cookie-based approach, use [puppeteer (Option 1)](./recipes/auth/README.md) instead.
## Option 4: Open a debug instance of Chrome and manually log in
1. Globally install lighthouse: `npm i -g lighthouse` or `yarn global add lighthouse`. `chrome-debug` is now in your PATH. This binary launches a standalone Chrome instance with an open debugging port.
1. Run chrome-debug. This logs the debugging port of your Chrome instance.
1. Navigate to your site and log in.
1. In a separate terminal, run `lighthouse http://mysite.com --disable-storage-reset --port port-number`, using the port number from chrome-debug.
## Option 5: Reuse a prepared Chrome User Profile
This option is currently under development. Track or join the discussion here: [#8957](https://github.com/GoogleChrome/lighthouse/issues/8957).
---
# Source: https://github.com/GoogleChrome/lighthouse/blob/main/docs/bug-labels.md
Given the new onslaught of issues that folks in the community are filing, we thought it might be good to explain some of our
bug labeling and triaging practices to the community.
## Bug Triaging Overview
Every week, there is a new "bug sheriff" (assigned from the core Lighthouse team) and their job is to go through and triage incoming bugs and pay attention to bugs
where we need more information from the reporter. Therefore, depending on the week, you might be hearing from a different
bug sheriff about your bug.
## Labeling Bugs
Here are the different (actively used) labels and what they mean, organized by category bucket:
### Priority Labels
- P0: Urgent issue- drop everything and deal with immediately
- P1: We want to work on this in the next few weeks
- P1.5: We want to work on this in the next few months
- P2: We want to work on this in the next few quarters.
- P3: Good idea, useful for future thinking.
### Process labels
- Needs more information: issue that hasn't been prioritized yet because we need more information from the bug creator. If we don't hear back in 2 weeks, we will close out the bug.
- Pending close: issue that we will soon close.
- Needs priority: issue that needs to be prioritized by team (as P0, P1, P1.5, etc.)
- Needs investigation: issue that we need to dig into to understand what is going on (mostly for bugs)
### Type of incoming issue labels
- Bug: something is wrong on our end and needs to be fixed.
- Feature: suggestion of new thing to implement.
- Internal cleanup: nothing is wrong but clean up and/or refactor of the existing way we're doing something.
- Question: question from community. Good fodder for new documentation that needs to be written.
### Other labels
- Good first issue: for new external contributor, these issues can be useful for them to tackle.
- Help wanted: issues that could use help from the community.
---
# Source: https://github.com/GoogleChrome/lighthouse/blob/main/docs/configuration.md
# Lighthouse Configuration
The Lighthouse config object is the primary method of customizing Lighthouse to suit your use case. Using a custom config, you can limit the audits to run, add additional loads of the page under special conditions, add your own custom checks, tweak the scoring, and more.
Read more about the [architecture of Lighthouse](./architecture.md).
## Usage
You can specify a custom config file when using Lighthouse through the CLI or consuming the npm module yourself.
**custom-config.js file**
```js
export default {
extends: 'lighthouse:default',
settings: {
onlyAudits: [
'speed-index',
'interactive',
],
},
};
```
**Use config file via CLI**
```sh
lighthouse --config-path=path/to/custom-config.js https://example.com
```
**Use config file via Node**
```js
import lighthouse from 'lighthouse';
import config from './path/to/custom-config.js';
await lighthouse('https://example.com/', {port: 9222}, config);
```
## Properties
| Name | Type | |
| - | - | - |
| extends | string|undefined |
| settings | Object|undefined |
| artifacts | Object[] |
| audits | string[] |
| categories | Object|undefined |
| groups | Object|undefined |
| plugins | string[] | Includes plugins and their audits. Refer to the [plugin documentation](https://github.com/GoogleChrome/lighthouse/blob/master/docs/plugins.md) for details.|
### `extends: "lighthouse:default"|undefined`
The `extends` property controls if your configuration should inherit from the default Lighthouse configuration. [Learn more.](#config-extension)
#### Example
```js
{
extends: 'lighthouse:default',
}
```
### `settings: Object|undefined`
The settings property controls various aspects of running Lighthouse such as CPU/network throttling and which audits should run.
#### Example
```js
{
settings: {
onlyCategories: ['performance'],
onlyAudits: ['works-offline'],
}
}
```
#### Options
For full list see [our config settings typedef](https://github.com/GoogleChrome/lighthouse/blob/575e29b8b6634bfb280bc820efea6795f3dd9017/types/externs.d.ts#L141-L186).
| Name | Type | Description |
| -- | -- | -- |
| onlyCategories | `string[]` | Includes only the specified categories in the final report. Additive with `onlyAudits` and reduces the time to audit a page. |
| onlyAudits | `string[]` | Includes only the specified audits in the final report. Additive with `onlyCategories` and reduces the time to audit a page. |
| skipAudits | `string[]` | Excludes the specified audits from the final report. Takes priority over `onlyCategories`, not usable in conjunction with `onlyAudits`, and reduces the time to audit a page. |
### `artifacts: Object[]`
The list of artifacts to collect on a single Lighthouse run. This property is required and on extension will be concatenated with the existing set of artifacts.
```js
{
artifacts: [
{id: 'Accessibility', gatherer: 'accessibility'},
{id: 'AnchorElements', gatherer: 'anchor-elements'},
]
}
```
| Name | Type | Description |
| -- | -- | -- |
| id | `string` | Unique identifier for this artifact. This is how the artifact is referenced in audits. |
| gatherer | `string` | Gatherer used to produce this artifact. Does not need to be unique within the `artifacts` list. |
### `audits: string[]`
The audits property controls which audits to run and include with your Lighthouse report. See [more examples](#more-examples) to see how to add custom audits to your config.
#### Example
```js
{
audits: [
'first-contentful-paint',
'byte-efficiency/unminified-css',
]
}
```
### `categories: Object|undefined`
The categories property controls how to score and organize the audit results in the report. Each category defined in the config will have an entry in the `categories` property of Lighthouse's output. The category output contains the child audit results along with an overall score for the category.
**Note:** many modules consuming Lighthouse have no need to group or score all the audit results; in these cases, it's fine to omit a categories section.
#### Example
```js
{
categories: {
performance: {
title: 'Performance',
description: 'This category judges your performance',
auditRefs: [
{id: 'first-contentful-paint', weight: 3, group: 'metrics'},
{id: 'interactive', weight: 5, group: 'metrics'},
],
}
}
}
```
#### Options
| Name | Type | Description |
| -- | -- | -- |
| title | `string` | The display name of the category. |
| description | `string` | The displayed description of the category. |
| supportedModes | `string[]` (optional, [user flows](https://github.com/GoogleChrome/lighthouse/blob/master/docs/user-flows.md)) | The modes supported by the category. Category will support all modes if this is not provided. |
| auditRefs | `Object[]` | The audits to include in the category. |
| auditRefs[$i].id | `string` | The ID of the audit to include. |
| auditRefs[$i].weight | `number` | The weight of the audit in the scoring of the category. |
| auditRefs[$i].group | `string` (optional) | The ID of the [display group](#groups-objectundefined) of the audit. |
### `groups: Object|undefined`
The groups property controls how to visually group audits within a category. For example, this is what enables the grouped rendering of metrics and accessibility audits in the report.
**Note: The report-renderer has display logic that's hardcoded to specific audit group names. Adding arbitrary groups without additional rendering logic may not perform as expected.**
#### Example
```js
{
categories: {
performance: {
auditRefs: [
{id: 'my-performance-metric', weight: 2, group: 'metrics'},
],
}
},
groups: {
'metrics': {
title: 'Metrics',
description: 'These metrics encapsulate your web app\'s performance across a number of dimensions.'
},
}
}
```
## Config Extension
The stock Lighthouse configurations can be extended if you only need to make small tweaks, such as adding an audit or skipping an audit, but wish to still run most of what Lighthouse offers. When adding the `extends: 'lighthouse:default'` property to your config, the artifacts, audits, groups, and categories will be automatically included, allowing you modify settings or add additional audits and artifacts.
Please note that the `extends` property only supports extension of `lighthouse:default`. Other internal configs found in the [core/config](https://github.com/GoogleChrome/lighthouse/tree/main/core/config) directory can be used by importing the config object from file reference, or by using the [`--preset`](https://github.com/GoogleChrome/lighthouse#cli-options) CLI flag.
See [more examples below](#more-examples) to view different types of extensions in action.
**Config extension is the recommended way to run custom Lighthouse**. If there's a use case that extension doesn't currently solve, we'd love to [hear from you](https://github.com/GoogleChrome/lighthouse/issues/new)!
## More Examples
The best examples are the ones Lighthouse uses itself! There are several reference configuration files that are maintained as part of Lighthouse.
* [core/config/default-config.js](https://github.com/GoogleChrome/lighthouse/blob/main/core/config/default-config.js)
* [core/config/lr-desktop-config.js](https://github.com/GoogleChrome/lighthouse/blob/main/core/config/lr-desktop-config.js)
* [core/config/lr-mobile-config.js](https://github.com/GoogleChrome/lighthouse/blob/main/core/config/lr-mobile-config.js)
* [core/config/perf-config.js](https://github.com/GoogleChrome/lighthouse/blob/main/core/config/perf-config.js)
* [docs/recipes/custom-audit/custom-config.js](https://github.com/GoogleChrome/lighthouse/blob/main/docs/recipes/custom-audit/custom-config.js)
* [pwmetrics](https://github.com/paulirish/pwmetrics/blob/v4.1.1/lib/perf-config.ts)
---
# Source: https://github.com/GoogleChrome/lighthouse/blob/main/docs/emulation.md
# Emulation in Lighthouse
In Lighthouse, "Emulation" refers to the screen/viewport emulation and UserAgent string spoofing.
["Throttling"](./throttling.md) covers the similar topics around network and CPU throttling/simulation.
With the default configuration, Lighthouse emulates a mobile device. There's [a `desktop` configuration](../core/config/desktop-config.js), available to CLI users with `--preset=desktop`, which applies a consistent desktop environment and scoring calibration. This is recommended as a replacement for `--emulated-form-factor=desktop`.
### Advanced emulation setups
Some products use Lighthouse in scenarios where emulation is applied outside of Lighthouse (e.g. by Puppeteer) or running against Chrome on real mobile devices.
You must always set `formFactor`. It doesn't control emulation, but it determines how Lighthouse should interpret the run in regards to scoring performance metrics and skipping mobile-only tests in desktop.
You can choose how `screenEmulation` is applied. It can accept an object of `{width: number, height: number, deviceScaleRatio: number, mobile: boolean, disabled: false}` to apply that screen emulation or an object of `{disabled: true}` if Lighthouse should avoid applying screen emulation. It's typically set to disabled if either emulation is applied outside of Lighthouse, or it's being run on a mobile device. The `mobile` boolean applies overlay scrollbars and a few other mobile-specific screen emulation characteristics.
You can choose how to handle userAgent emulation. The `emulatedUserAgent` property accepts either a `string` to apply the provided userAgent or a `boolean` -- `true` if the default UA spoofing should be applied (default) or `false` if no UA spoofing should be applied. Typically `false` is used if UA spoofing is applied outside of Lighthouse or on a mobile device. You can also redundantly apply userAgent emulation with no risk.
If you're using Lighthouse on a mobile device, you want to set `--screenEmulation.disabled` and `--throttling.cpuSlowdownMultiplier=1`. (`--formFactor=mobile` is the default already).
### Changes made in v7
In Lighthouse v7, most of the configuration regarding emulation changed to be more intuitive and clear. The [tracking issue](https://github.com/GoogleChrome/lighthouse/issues/10910
) captures additional motivations.
* Removed: The `emulatedFormFactor` property (which determined how emulation is applied).
* Removed: The `TestedAsMobileDevice` artifact. Instead of being inferred, the explicit `formFactor` property is used.
* Removed: The `internalDisableDeviceScreenEmulation` property. It's equivalent to the new `--screenEmulation.disabled=true`.
* Added: The `formFactor` property.
* Added: The `screenEmulation` property.
* Added: The `emulatedUserAgent` property.
* (`throttling` and `throttlingMethod` remain unchanged)
---
# Source: https://github.com/GoogleChrome/lighthouse/blob/main/docs/error-reporting.md
# Error Reporting Explained
## What's going on?
The Lighthouse team is constantly trying to improve the reliability of our tools, so we've added error tracking functionality to the CLI. Given your consent, we would like to anonymously report runtime exceptions using [Sentry](https://sentry.io/welcome/). We will use this information to detect new bugs and avoid regressions.
Only CLI users are currently impacted. DevTools, extension, and node module users will not have errors reported.
## What will happen if I opt-in?
Runtime exceptions will be reported to the team along with information on your environment such as the URL you tested, your OS, and Chrome version. See [what data gets reported](#what-data-gets-reported).
## What will happen if I do not opt-in?
Runtime exceptions will not be reported to the team. Your ability to use Lighthouse will not be affected in any way.
## What data gets reported?
* The URL you tested
* The runtime settings used (throttling enabled/disabled, emulation, etc)
* The message, stack trace, and associated data of the error
* The file path of Lighthouse node module on your machine
* Your Lighthouse version
* Your Chrome version
* Your operating system
[This code search](https://github.com/GoogleChrome/lighthouse/search?l=JavaScript&q=Sentry.&type=&utf8=%E2%9C%93) reveals where Sentry methods are used.
## How do I opt-in?
The first time you run the CLI you will be prompted with a message asking you if Lighthouse can anonymously report runtime exceptions. You can give a direct response of `yes` or `no` (`y`, `n`, and pressing enter which defaults to `no` are also acceptable responses), and you will not be prompted again. If no response is given within 20 seconds, a `no` response will be assumed and you will not be prompted again.
Running Lighthouse with `--enable-error-reporting` will report errors regardless of the saved preference.
## How do I keep error reporting disabled?
As mentioned, if you do not respond to the CLI prompt within 20 seconds, a `no` response will be assumed and you will not be prompted again.
Non-interactive terminal sessions (`process.stdout.isTTY === false`) and invocations with the `CI` environment variable (`process.env.CI === true`), common on CI providers like Travis and AppVeyor, will not be prompted and error reporting will remain disabled.
Running Lighthouse with `--no-enable-error-reporting` will keep error reporting disabled regardless of the saved preference.
## How do I change my opt-in preference?
Your response to the prompt will be saved to your home directory `~/.config/configstore/lighthouse.json` and used on future runs. To trigger a re-prompt, simply delete this file and Lighthouse will ask again on the next run. You can also edit this json file directly.
As mentioned above, any explicit `--[no-]enable-error-reporting` flags will override the saved preference.
---
# Source: https://github.com/GoogleChrome/lighthouse/blob/main/docs/hacking-tips.md
A few assorted scripts and tips to make hacking on Lighthouse a bit easier
# Eng team resources
* [LH Build Tracker](https://lh-build-tracker.herokuapp.com/builds/limit/100) - plotted results of [build-tracker](../build-tracker.config.js) [data](../.github/workflows/ci.yml#:~:text=buildtracker)
* [LH PR Tracking](https://paulirish.github.io/lh-pr-tracking/) - stats about open PRs, collected [daily](https://github.com/paulirish/lh-pr-tracking/blob/master/.github/workflows/update-stats.yml).
## Evaluate Lighthouse's runtime performance
Lighthouse has instrumentation to collect timing data for its operations. The data is exposed at `LHR.timing.entries`. You can generate a trace from this data for closer analysis.

[View example trace](https://ahead-daughter.surge.sh/paulirish.json.timing.trace.html)
To generate, run `yarn timing-trace` with the LHR json:
```sh
lighthouse http://example.com --output=json --output-path=lhr.json
yarn timing-trace lhr.json
```
That will generate `lhr.json.timing.trace.json`. Then, drag 'n drop that file into `chrome://tracing`.
## Unhandled promise rejections
Getting errors like these?
> (node:12732) UnhandledPromiseRejectionWarning: Unhandled promise rejection (rejection id: 1)
> (node:12732) DeprecationWarning: Unhandled promise rejections are deprecated. In the future, promise rejections that are not handled will terminate the Node.js process with a non-zero exit code.
Use [`--trace-warnings`](https://medium.com/@jasnell/introducing-process-warnings-in-node-v6-3096700537ee) to get actual stack traces.
```sh
node --trace-warnings cli http://example.com
```
## Iterating on the report
This will generate new reports from the same results json.
```sh
# capture some results first:
lighthouse http://example.com --output=json > temp.report.json
# quickly generate reports:
node generate_report.js > temp.report.html; open temp.report.html
```
```js
// generate_report.js
import {ReportGenerator} from './report/generator/report-generator.js';
import results from './temp.report.json' assert { type: 'json' };
const html = ReportGenerator.generateReportHtml(results);
console.log(html);
```
## Using Audit Classes Directly, Providing Your Own Artifacts
See [gist](https://gist.github.com/connorjclark/d4555ad90ae5b5ecf793ad2d46ca52db).
## Mocking modules with testdouble
We use `testdouble` and `mocha` to mock modules for testing. However, [mocha will not "hoist" the mocks](https://jestjs.io/docs/ecmascript-modules#module-mocking-in-esm) so any imports that depend on a mocked module need to be done dynamically *after* the testdouble mock is applied.
Analyzing the dependency trees can be complicated, so we recommend importing as many modules as possible (read: all non-test modules, typically) dynamically and only using static imports for test libraries (e.g. `testdouble`, `jest-mock`, `assert`). For example:
```js
import jestMock from 'jest-mock';
import * as td from 'testdouble';
await td.replaceEsm('./module-to-mock.js', {
mockedFunction: jestMock.fn(),
});
// module-to-mock.js is imported somewhere in the dependency tree of root-module.js
const rootModule = await import('./root-module.js');
```
---
# Source: https://github.com/GoogleChrome/lighthouse/blob/main/docs/headless-chrome.md
# Running Lighthouse using headless Chrome
## CLI (headless)
Setup:
```sh
# Lighthouse requires Node 22 LTS (22.x) or later.
curl -sL https://deb.nodesource.com/setup_22.x | sudo -E bash - &&\
sudo apt-get install -y nodejs npm
# get chromium (stable)
apt-get install chromium
# install lighthouse
npm i -g lighthouse
```
Kick off run of Lighthouse using headless Chrome:
```sh
lighthouse --chrome-flags="--headless" https://github.com
```
## (CLI headless=new)
There is also the new `--headless=new` option, which includes functionality that
was explicitly omitted from the original headless browser.
## CLI (xvfb)
Alternatively, you can run full Chrome + xvfb instead of headless mode. These steps worked on Debian Jessie:
```sh
# get node 22
curl -sL https://deb.nodesource.com/setup_22.x | sudo -E bash -
sudo apt-get install -y nodejs npm
# get chromium (stable) and Xvfb
apt-get install chromium-browser xvfb
# install lighthouse
npm i -g lighthouse
```
Run it:
```sh
export DISPLAY=:1.5
TMP_PROFILE_DIR=$(mktemp -d -t lighthouse.XXXXXXXXXX)
# start up chromium inside xvfb
xvfb-run --server-args='-screen 0, 1024x768x16' \
chromium-browser --user-data-dir=$TMP_PROFILE_DIR \
--start-maximized \
--no-first-run \
--remote-debugging-port=9222 "about:blank"
# Kick off Lighthouse run on same port as debugging port.
lighthouse --port=9222 https://github.com
```
## Posting Lighthouse reports to GitHub Gists
Be sure to replace `${GITHUB_OWNER}` and `${GITHUB_TOKEN}` with your own credentials. The code below is tested on Ubuntu.
```sh
apt-get install -y nodejs npm chromium jq
npm install -g lighthouse
# Run lighthouse as JSON, pipe it to jq to wrangle and send it to GitHub Gist via curl
# so Lighthouse Viewer can grab it.
lighthouse "http://localhost" --chrome-flags="--no-sandbox --headless" \
--output json \
| jq -r "{ description: \"YOUR TITLE HERE\", public: \"false\", files: {\"$(date "+%Y%m%d").lighthouse.report.json\": {content: (. | tostring) }}}" \
| curl -sS -X POST -H 'Content-Type: application/json' \
-u ${GITHUB_OWNER}:${GITHUB_TOKEN} \
-d @- https://api.github.com/gists > results.gist
# Let's be nice and add the Lighthouse Viewer link in the Gist description.
GID=$(cat results.gist | jq -r '.id') && \
curl -sS -X POST -H 'Content-Type: application/json' \
-u ${GITHUB_OWNER}:${GITHUB_TOKEN} \
-d "{ \"description\": \"YOUR TITLE HERE - Lighthouse: https://googlechrome.github.io/lighthouse/viewer/?gist=${GID}\" }" "https://api.github.com/gists/${GID}" > updated.gist
```
## Node module
Install:
```sh
yarn add lighthouse
```
Run it:
```javascript
const lighthouse = require('lighthouse');
const chromeLauncher = require('chrome-launcher');
function launchChromeAndRunLighthouse(url, flags = {}, config = null) {
return chromeLauncher.launch(flags).then(chrome => {
flags.port = chrome.port;
return lighthouse(url, flags, config).then(results => {
chrome.kill();
return results;
}
});
}
const flags = {
chromeFlags: ['--headless']
};
launchChromeAndRunLighthouse('https://github.com', flags).then(results => {
// Use results!
});
```
## Other resources
Other resources you might find helpful:
- [Getting Started with Headless Chrome](https://developers.google.com/web/updates/2017/04/headless-chrome)
- Example [Dockerfile](https://github.com/GoogleChrome/lighthouse-ci/blob/main/docs/recipes/docker-client/Dockerfile)
- Lighthouse's GitHub Actions [`.ci.yml`](https://github.com/GoogleChrome/lighthouse/blob/main/.github/workflows/ci.yml)
---
# Source: https://github.com/GoogleChrome/lighthouse/blob/main/docs/lantern.md
# Lantern
## Overview
Project Lantern is an ongoing effort to reduce the run time of Lighthouse and improve audit quality by modeling page activity and simulating browser execution. This document details the accuracy of these models and captures the expected natural variability.
## Deep Dive
[](https://www.youtube.com/watch?v=0dkry1r49xw)
## Accuracy
All of the following accuracy stats are reported on a set of 300 URLs sampled from the Alexa top 1000, HTTPArchive dataset, and miscellaneous ad landing pages. Median was collected for *9 runs* in one environment and compared to the median of *9 runs* in a second environment.
Stats were collected using the [trace-evaluation](https://github.com/patrickhulce/lighthouse-trace-evaluations) scripts. Table cells contain [Spearman's rho](https://en.wikipedia.org/wiki/Spearman%27s_rank_correlation_coefficient) and [MAPE](https://en.wikipedia.org/wiki/Mean_absolute_percentage_error) for the respective metric.
### Lantern Accuracy Stats
| Comparison | FCP | FMP | TTI |
| -- | -- | -- | -- |
| Lantern predicting Default LH | .811 : 23.1% | .811 : 23.6% | .869 : 42.5% |
| Lantern predicting LH on WPT | .785 : 28.3% | .761 : 33.7% | .854 : 45.4% |
### Reference Stats
| Comparison | FCP | FMP | TTI |
| -- | -- | -- | -- |
| Unthrottled LH predicting Default LH | .738 : 27.1% | .694 : 33.8% | .743 : 62.0% |
| Unthrottled LH predicting WPT | .691 : 33.8% | .635 : 33.7% | .712 : 66.4% |
| Default LH predicting WPT | .855 : 22.3% | .813 : 27.0% | .889 : 32.3% |
## Conclusions
### Lantern Accuracy Conclusions
We conclude that Lantern is ~6-13% more inaccurate than DevTools throttling. When evaluating rank performance, Lantern achieves correlations within ~.04-.07 of DevTools throttling.
* For the single view use case, our original conclusion that Lantern's inaccuracy is roughly equal to the inaccuracy introduced by expected variance seems to hold. The standard deviation of single observations from DevTools throttling is ~9-13%, and given Lantern's much lower variance, single observations from Lantern are not significantly more inaccurate on average than single observations from DevTools throttling.
* For the repeat view use case, we can conclude that Lantern is systematically off by ~6-13% more than DevTools throttling.
### Metric Variability Conclusions
The reference stats demonstrate that there is high degree of variability with the user-centric metrics and strengthens the position that every load is just an observation of a point drawn from a distribution and to understand the entire experience, multiple draws must be taken, i.e. multiple runs are needed to have sufficiently small error bounds on the median load experience.
The current size of confidence intervals for DevTools throttled performance scores are as follows.
* 95% confidence interval for **1-run** of site at median: 50 **+/- 15** = 65-35
* 95% confidence interval for **3-runs** of site at median: 50 **+/- 11** = 61-39
* 95% confidence interval for **5-runs** of site at median: 50 **+/- 8** = 58-42
## Links
* [Lighthouse Variability and Accuracy Analysis](https://docs.google.com/document/d/1BqtL-nG53rxWOI5RO0pItSRPowZVnYJ_gBEQCJ5EeUE/edit?usp=sharing)
* [Lantern Deck](https://docs.google.com/presentation/d/1EsuNICCm6uhrR2PLNaI5hNkJ-q-8Mv592kwHmnf4c6U/edit?usp=sharing)
* [Lantern Design Doc](https://docs.google.com/a/chromium.org/document/d/1pHEjtQjeycMoFOtheLfFjqzggY8VvNaIRfjC7IgNLq0/edit?usp=sharing)
* [WPT Trace Data Set Half 1](https://drive.google.com/open?id=1Y_duiiJVljzIEaYWEmiTqKQFUBFWbKVZ) (access on request)
* [WPT Trace Data Set Half 2](https://drive.google.com/open?id=1EoHk8nQaBv9aoaVv81TvR7UfXTUu2fiu) (access on request)
* [Unthrottled Trace Data Set Half 1](https://drive.google.com/open?id=1axJf9R3FPpzxhR7FKOvXPLFLxxApfwD0) (access on request)
* [Unthrottled Trace Data Set Half 2](https://drive.google.com/open?id=1krcWq5DF0oB1hq90G29bEwIP7zDcJrYY) (access on request)
---
# Source: https://github.com/GoogleChrome/lighthouse/blob/main/docs/new-audits.md
So, you want to create a new audit? Great! We're excited that you want to add to the Lighthouse project :) The goal of this
document is to help you understand what constitutes as a "good" audit for Lighthouse, and steps you can follow if you want
to propose a new audit.
## New audit principles
Lighthouse audits that surface in the report should:
- be applicable to a significant portion of web developers (based on scale and severity of impact)
- contribute significantly towards making the mobile web experience better for end users.
- not have a significant impact on our runtime performance or bundle size.
- be new, not something that is already measured by existing audits.
- be measurable (especially for performance audits) or have clear pass/fail states.
- be actionable - when failing, specific advice should be given. If the failure can be tied to a specific resource (a DOM element, script, line of code), use the appropriate detail type (see below). If multiple failures can occur for a page, return a table.
- not use 3rd party APIs for completing the audit check.
## Actionability
1. Specific advice should be given if the audit fails. If an audit can fail in multiple ways, each way should have specific guidance that the user should take to resolve the problem.
1. If the failure can be applied to a specific resource, use the appropriate detail type (see subsection).
1. If multiple failures can occur on a single page, show each (use a table - don't just return a binary score).
### Detail Types
An audit can return a number of different [detail types](https://github.com/GoogleChrome/lighthouse/blob/main/types/lhr/audit-details.d.ts).
| detail type | resource | notes |
|---------------------------|-----------------------|----------------------------------------|
| `'node'` | DOM element | set path to a devtoolsNodePath |
| `'source-location'` | Code Network Resource | use to point to specific line, column |
| `'code'` | N/A; freeform | render as monospace font `like this` |
| `'url'` | Network Resource | we will make it a pretty link |
| `'thumbnail'` | Image Resource | same as above, but we show a thumbnail |
| `'link'` | - | arbitrary link / url combination |
| `'bytes'` | - | value is in bytes but formatted as KiB |
| `'text'\|'ms'\|'numeric'` | - | |
### Granularity
The following detail types accept a `granularity` field:
- `bytes`
- `ms`
- `numeric`
`granularity` must be an integer power of 10. Some examples of valid values for `granularity`:
- 0.001
- 0.01
- 0.1
- 1
- 10
- 100
The formatted value will be rounded to that nearest number. If not provided, the default is `0.1` (except for `ms`, which is `10`).

## Naming
### Audit ID
The audit ID should be based on the noun of the subject matter that it surfaces to the user.
The filename should match the audit ID.
**Policy**
- No verbs.
- No `no-` prefixes.
- Use the noun of the items it surfaces or concept it centers around.
- Adjective modifiers are acceptable and encouraged if the noun would be too broad without specificity.
- If an adjective modifier will result in describing either the passing or failing state, prefer the failing state.
**Examples**
- ~~no-vulnerable-dependencies~~ vulnerable-dependencies (no `no-`)
- ~~redirects-http~~ http-redirect (no verbs)
- ~~uses-long-cache-ttl~~ cache-headers (no verbs)
- ~~is-crawlable~~ crawlability (no verbs)
- ~~images~~ oversized-images (too broad)
- ~~used-css~~ unused-css (prefer failing state adjective)
### Audit Title / Failure Title
Audit titles vary based on report context and audit type.
- Opportunities should have an *imperative* `title` describing the action the developer should take to fix the issue.
- Standard audits should have both a *descriptive* `title` and a `failureTitle` that describe what the page is currently doing that resulted in a passing/failing state.
Opportunity `title`: "Compress large images"
Standard Audit `title`: "Page works offline"
Standard Audit `failureTitle`: "Page does not work offline"
## Process for creating a new audit
1. Scan the criteria we’ve laid out above. If you think the principles match with your proposed new audit, then proceed!
1. Next step is to create an issue on GitHub with answers to the following questions:
```
#### Provide a basic description of the audit
#### How would the audit appear in the report?
#### How is this audit different from existing ones?
#### What % of developers/pages will this impact?
#### How is the new audit making a better web for end users?
#### What is the resourcing situation?
#### Any other links or documentation that we should check out?
```
3. Once the proposal is submitted, then Lighthouse team will take a look and followup. We will discuss possible implementation approaches, and associated runtime overhead.
With this new information we can better understand the impl cost and effort required and prioritize the audit into our sprint/roadmap.
1. Depending on the prioritization, we'll then work with you to figure out the necessary engineering/UX/product details.
---
# Source: https://github.com/GoogleChrome/lighthouse/blob/main/docs/plugins.md
# Plugin Handbook
## Table of Contents
1. [Introduction](#introduction)
1. [What is a Lighthouse Plugin?](#what-is-a-lighthouse-plugin)
1. [Comparing a Plugin vs. Custom Config](#comparing-a-plugin-vs-custom-config)
1. [Getting Started](#getting-started)
1. [API](#api)
1. [Plugin Config](#plugin-config)
1. [Plugin Audits](#plugin-audits)
1. [Best Practices](#best-practices)
1. [Naming](#naming)
1. [Scoring](#scoring)
1. [Common Mistakes](#common-mistakes)
1. [Examples](#examples)
## Introduction
If you're new to Lighthouse development, start by reading up on the overall [architecture](./architecture.md), how [configuration](./configuration.md) works, and what makes a [good audit](./new-audits.md) before continuing.
### What is a Lighthouse Plugin?
Lighthouse plugins are a way to extend the functionality of Lighthouse with insight from domain experts (that's you!) and easily share this extra functionality with other Lighthouse users. At its core, a plugin is a node module that implements a set of checks that will be run by Lighthouse and added to the report as a new category.
### Comparing a Plugin vs. Custom Config
Plugins are easily shared and have a stable API that won't change between minor version bumps but are also more limited in scope than a [custom Lighthouse configuration](./configuration.md). Before getting started with plugins, think about your current needs, and consult the table below to decide which is best for you.
| Capability | Plugin | Custom Config |
| -------------------------------------------- | ------ | ------------- |
| Include your own custom audits | ✅ | ✅ |
| Add a custom category | ✅ | ✅ |
| Easily shareable and extensible on NPM | ✅ | ❌ |
| Semver-stable API | ✅ | ❌ |
| Gather custom data from the page (artifacts) | ❌ | ✅ |
| Modify core categories | ❌ | ✅ |
| Modify `config.settings` properties | ❌ | ✅ |
### Getting Started
To develop a Lighthouse plugin, you'll need to write three things:
1. A `package.json` file to define your plugin's dependencies and point to your `plugin.js` file.
1. A `plugin.js` file to declare your plugin's audits, category name, and scoring.
1. Custom audit files that will contain the primary logic of the checks you want to perform.
To see a fully functioning example, see our [plugin recipe](./recipes/lighthouse-plugin-example/readme.md) or its [GitHub repository template](https://github.com/GoogleChrome/lighthouse-plugin-example).
#### `package.json`
A Lighthouse plugin is just a node module with a name that starts with `lighthouse-plugin-`. Any dependencies you need are up to you. However, do not depend on Lighthouse directly, use [`peerDependencies`](http://npm.github.io/using-pkgs-docs/package-json/types/peerdependencies.html) to alert dependents, and `devDependencies` for your own local development:
**Example `package.json`**
```json
{
"name": "lighthouse-plugin-example",
"type": "module",
"main": "plugin.js",
"peerDependencies": {
"lighthouse": "^13.0.1"
},
"devDependencies": {
"lighthouse": "^13.0.1"
}
}
```
#### `plugin.js`
This file contains the configuration for your plugin. It can be called anything you like, just ensure it is referenced by the `"main"` property in your `package.json`.
**Example `plugin.js`**
```js
export default {
// Additional audits to run on information Lighthouse gathered.
audits: [{path: 'lighthouse-plugin-example/audits/has-cat-images.js'}],
// A new category in the report for the plugin output.
category: {
title: 'Cats',
description:
'When integrated into your website effectively, cats deliver delight and bemusement.',
auditRefs: [{id: 'has-cat-images-id', weight: 1}],
},
};
```
#### Custom Audits
These files contain the logic that will generate results for the Lighthouse report. An audit is a class with two important properties:
1. `meta` - This contains important information about how the audit will be referenced and how it will be displayed in the HTML report.
2. `audit` - This is a function that should return the audit's results. See [API > Plugin Audits](#plugin-audits).
**Example `audits/has-cat-images.js`**
```js
import {Audit} from 'lighthouse';
class CatAudit extends Audit {
static get meta() {
return {
id: 'has-cat-images-id',
title: 'Page has least one cat image',
failureTitle: 'Page does not have at least one cat image',
description:
'Pages should have lots of cat images to keep users happy. ' +
'Consider adding a picture of a cat to your page improve engagement.',
requiredArtifacts: ['ImageElements'],
};
}
static audit(artifacts) {
// Artifacts requested in `requiredArtifacts` above are passed to your audit.
// See the "API -> Plugin Audits" section below for what artifacts are available.
const images = artifacts.ImageElements;
const catImages = images.filter(image => image.src.toLowerCase().includes('cat'));
return {
// Give users a 100 if they had a cat image, 0 if they didn't.
score: catImages.length > 0 ? 1 : 0,
// Also return the total number of cat images that can be used by report JSON consumers.
numericValue: catImages.length,
};
}
}
export default CatAudit;
```
#### Run the plugin locally in development
```sh
# be in your plugin directory, and have lighthouse as a devDependency.
NODE_PATH=.. npx lighthouse -- https://example.com --plugins=lighthouse-plugin-example --only-categories=lighthouse-plugin-example --view
# Note: we add the parent directory to NODE_PATH as a hack to allow Lighthouse to find this plugin.
# This is useful for local development, but is not necessary when your plugin consuming from NPM as
# a node module.
```
## API
### Plugin Config
The plugin config file (see `plugin.js` in the [example](#pluginjs) and [recipe](./recipes/lighthouse-plugin-example/plugin.js)) is a subset of the available [configuration](./configuration.md) for full custom Lighthouse config files.
A plugin config is an object that has at least two properties: `audits` and `category`.
#### `audits`
Defines the new audits the plugin adds. It is an array of string paths to the audit files. Each path should be treated as an absolute string a user of your module might pass to `require`, so use paths of the form `lighthouse-plugin-/path/to/audits/audit-file.js`.
**Type**: `Array<{path: string}>`
#### `category`
Defines the display strings of the plugin's category and configures audit scoring and grouping. It is an object with at least two properties `title` and `auditRefs`.
- `title: string` **REQUIRED** - The display name of the plugin's category in the report.
- `description: string` _OPTIONAL_ - A more detailed description of the category's purpose.
- `manualDescription: string` _OPTIONAL_ - A more detailed description of all of the manual audits in a plugin. Only use this if you've added manual audits.
- `auditRefs: Array<{id: string, weight: number, group?: string}>` **REQUIRED** - The list of audits to include in the plugin category along with their overall weight in the score of the plugin category. Each audit ref may optionally reference a group ID from `groups`.
- `supportedModes: string[]` _OPTIONAL_ - Which Lighthouse [modes](https://github.com/GoogleChrome/lighthouse/blob/master/docs/user-flows.md) this plugin supports. Category will support all modes if this is not provided.
#### `groups`
Defines the audit groups used for display in the HTML report.
It is an object whose keys are the group IDs and whose values are objects with the following properties:
- `title: string` **REQUIRED** - The display name of the group in the report.
- `description: string` _OPTIONAL_ - A more detailed description of the group's purpose.
**Example of Category with Groups**
 **Example of Category _without_ Groups**
 ### Plugin Audits
A plugin audit is a class that implements at least two properties: `meta` and `audit()`.
#### `meta`
The `meta` property is a static getter for the metadata of an [audit](#custom-audits). It should return an object with the following properties:
- `id: string` **REQUIRED** - The string identifier of the audit, in kebab case, typically matching the file name.
- `title: string` **REQUIRED** - Short, user-visible title for the audit when successful.
- `failureTitle: string` _OPTIONAL_ - Short, user-visible title for the audit when failing.
- `description: string` **REQUIRED** - A more detailed description that describes why the audit is important and links to Lighthouse documentation on the audit; markdown links supported.
- `requiredArtifacts: Array` **REQUIRED** - A list of artifacts that must be present for the audit to execute. See [Available Artifacts](#available-artifacts) for what's available to plugins.
- `scoreDisplayMode: "numeric" | "binary" | "manual" | "informative"` _OPTIONAL_ - A string identifying how the score should be interpreted for display.
See [Best Practices > Naming](#naming) for best practices on the display strings.
#### `audit(artifacts, context)`
The `audit()` property is a function the computes the audit results for the report. It accepts two arguments: `artifacts` and `context`. `artifacts` is an object whose keys will be the values you passed to `requiredArtifacts` in the `meta` object. `context` is an internal object whose primary use in plugins is to derive network request information (see [Using Network Requests](#using-network-requests)).
The primary objective of the audit function is to return a `score` from `0` to `1` based on the data observed in `artifacts`. There are several other properties that can be returned by an audit to control additional display features. For the complete list, see the [audit results documentation](./understanding-results.md#audit-properties) and [type information](https://github.com/GoogleChrome/lighthouse/blob/623b789497f6c87f85d366b4038deae5dc701c90/types/audit.d.ts#L69-L87).
#### Available Artifacts
The following artifacts are available for use in the audits of Lighthouse plugins. For more detailed information on their usage and purpose, see the [type information](https://github.com/GoogleChrome/lighthouse/blob/main/types/artifacts.d.ts#L42-L99).
- `fetchTime`
- `BenchmarkIndex`
- `settings`
- `Timing`
- `HostFormFactor`
- `HostUserAgent`
- `HostProduct`
- `GatherContext`
- `URL`
- `ConsoleMessages`
- `DevtoolsLog`
- `MainDocumentContent`
- `ImageElements`
- `LinkElements`
- `MetaElements`
- `Scripts`
- `Trace`
- `ViewportDimensions`
While Lighthouse has more artifacts with information about the page than are in this list, those artifacts are considered experimental and their structure or existence could change at any time. Only use artifacts not on the list above if you are comfortable living on the bleeding edge and can tolerate unannounced breaking changes.
If you're interested in other page information not mentioned here, please file an issue. We'd love to help.
#### Using Network Requests
You might have noticed that a simple array of network requests is missing from the list above. The source information for network requests made by the page is actually contained in the `DevtoolsLog` artifact, which contains all the of DevTools Protocol traffic recorded during page load. The network request objects are derived from this message log at audit time.
See below for an example of an audit that processes network requests.
```js
import {Audit, NetworkRecords} from 'lighthouse';
class HeaderPoliceAudit {
static get meta() {
return {
id: 'header-police-audit-id',
title: 'All headers stripped of debug data',
failureTitle: 'Headers contained debug data',
description: 'Pages should mask debug data in production.',
requiredArtifacts: ['DevtoolsLog'],
};
}
static async audit(artifacts, context) {
// Request the network records from the devtools log.
// The `context` argument is passed in to allow Lighthouse to cache the result and not re-compute the network requests for every audit that needs them.
const devtoolsLog = artifacts.DevtoolsLog;
const requests = await NetworkRecords.request(devtoolsLog, context);
// Do whatever you need to with the network requests.
const badRequests = requests.filter(request =>
request.responseHeaders.some(header => header.name.toLowerCase() === 'x-debug-data')
);
return {
score: badRequests.length === 0 ? 1 : 0,
};
}
}
export default HeaderPoliceAudit;
```
## Best Practices
### Naming
> There are only two hard things in Computer Science: cache invalidation and naming things.
> Phil Karlton
There are several display strings you will need to write in the course of plugin development. To ensure your plugin users have a consistent experience with the rest of the Lighthouse report, follow these guidelines.
#### Category Titles
Write category titles that are short (fewer than 20 characters), ideally a single word or acronym. Avoid unnecessary prefixes like "Lighthouse" or "Plugin" which will already be clear from the context of the report.
#### Category Descriptions
Write category descriptions that provide context for your plugin's audits and link to where users can learn more or ask questions about their advice.
#### Audit Titles
Write audit titles in the _present_ tense that _describe_ what the page is successfully or unsuccessfully doing.
**DO**
> Document has a `` element
> Document does not have a `<title>` element
> Uses HTTPS
> Does not use HTTPS
> Tap targets are sized appropriately
> Tap targets are not sized appropriately
**DON'T**
> Good job on `alt` attributes
> Fix your headers
#### Audit Descriptions
Write audit descriptions that provide brief context for why the audit is important and link to more detailed guides on how to follow its advice. Markdown links are supported, so use them!
**DO**
> Interactive elements like buttons and links should be large enough (48x48px), and have enough space around them, to be easy enough to tap without overlapping onto other elements. [Learn more](https://developers.google.com/web/fundamentals/accessibility/accessible-styles#multi-device_responsive_design).
> All sites should be protected with HTTPS, even ones that don\'t handle sensitive data. HTTPS prevents intruders from tampering with or passively listening in on the communications between your app and your users, and is a prerequisite for HTTP/2 and many new web platform APIs. [Learn more](https://developers.google.com/web/tools/lighthouse/audits/https).
**DON'T**
> Images need alt attributes.
> 4.8.4.4 Requirements for providing text to act as an alternative for images
> Except where otherwise specified, the alt attribute.... 10,000 words later... and that is everything you need to know about the `alt` attribute!
### Scoring
1. Weight each audit by its importance.
1. Differentiate scores within an audit by returning a number _between_ `0` and `1`. Scores greater than `0.9` will be hidden in "Passed Audits" section by default.
1. Avoid inflating scores unnecessarily by marking audits as not applicable. When an audit's advice doesn't apply, simply `return {score: null, notApplicable: true}`.
### Common Mistakes
The web is a diverse place, and your plugin will be run on pages you never thought existed. Here are a few things to keep in mind when writing your audit to avoid common bugs. The Lighthouse team has made all of these mistakes below, so you're in good company!
#### Forgetting to Filter
Most audits will have a specific use case in mind that will apply to most elements or requests, but there are corner cases that come up fairly frequently that are easy to forget.
**Examples:**
- Non-network network requests (`blob:`, `data:`, `file:`, etc)
- Non-javascript scripts (`type="x-shader/x-vertex"`, `type="application/ld+json"`, etc)
- Tracking pixel images (images with size 1x1, 0x0, etc)
#### Forgetting to Normalize
Most artifacts will try to represent as truthfully as possible what was observed from the page. When possible, the values are normalized according to the spec as you would access them from the DOM, but typically no transformation beyond this is done. This means that some values will have leading or trailing whitespace, be mixed-case, potentially missing, relative URLs instead of absolute, etc.
**Examples:**
- Header names and values
- Script `type` values
- Script `src` values
## Examples
- [Cinememe Plugin](https://github.com/exterkamp/lighthouse-plugin-cinememe) - Find and reward dank cinememes (5MB+ animated GIFs ;)
- [YouTube Embed](https://github.com/connorjclark/lighthouse-plugin-yt) - Identifies YouTube embeds
- [Lighthouse Plugin Recipe](./recipes/lighthouse-plugin-example)
- [Field Performance](https://github.com/treosh/lighthouse-plugin-field-performance) - A plugin to gather and display Chrome UX Report field data
- [Publisher Ads Audits](https://github.com/googleads/pub-ads-lighthouse-plugin) - a well-written, but complex, plugin
- [Green Web Foundation](https://github.com/thegreenwebfoundation/lighthouse-plugin-greenhouse) - A plugin to see which domains run on renewable power.
- [requests-content-md5](https://www.npmjs.com/package/lighthouse-plugin-md5) - Generates MD5 hashes from the content of network requests..
---
# Source: https://github.com/GoogleChrome/lighthouse/blob/main/docs/puppeteer.md
# Using Puppeteer with Lighthouse
## Recipes
### [Using Puppeteer for authenticated pages](./recipes/auth/README.md)
### [Using Puppeteer in a custom gatherer](https://github.com/GoogleChrome/lighthouse/tree/main/docs/recipes/custom-gatherer-puppeteer)
## General Process
### Option 1: Launch Chrome with Puppeteer and handoff to Lighthouse
The example below shows how to inject CSS into the page before Lighthouse audits the page.
A similar approach can be taken for injecting JavaScript.
```js
import puppeteer from 'puppeteer';
import lighthouse from 'lighthouse';
const url = 'https://chromestatus.com/features';
// Use Puppeteer to launch headless Chrome
// - Omit `--enable-automation` (See https://github.com/GoogleChrome/lighthouse/issues/12988)
// - Don't use 800x600 default viewport
const browser = await puppeteer.launch({
// Set to false if you want to see the script in action.
headless: 'new',
defaultViewport: null,
ignoreDefaultArgs: ['--enable-automation']
});
const page = await browser.newPage();
// Wait for Lighthouse to open url, then inject our stylesheet.
browser.on('targetchanged', async target => {
if (page && page.url() === url) {
await page.addStyleTag({content: '* {color: red}'});
}
});
// Lighthouse will open the URL.
// Puppeteer will observe `targetchanged` and inject our stylesheet.
const {lhr} = await lighthouse(url, undefined, undefined, page);
console.log(`Lighthouse scores: ${Object.values(lhr.categories).map(c => c.score).join(', ')}`);
await browser.close();
```
### Option 2: Launch Chrome with Lighthouse/chrome-launcher and handoff to Puppeteer
When using Lighthouse programmatically, you'll often use chrome-launcher to launch Chrome.
Puppeteer can reconnect to this existing browser instance like so:
```js
import chromeLauncher from 'chrome-launcher';
import puppeteer from 'puppeteer';
import lighthouse from 'lighthouse';
const url = 'https://chromestatus.com/features';
// Launch chrome using chrome-launcher.
const chrome = await chromeLauncher.launch();
// Connect to it using puppeteer.connect().
const resp = await fetch(`http://localhost:${chrome.port}/json/version`);
const {webSocketDebuggerUrl} = await resp.json();
const browser = await puppeteer.connect({browserWSEndpoint: webSocketDebuggerUrl});
const page = await browser.newPage();
// Run Lighthouse.
const {lhr} = await lighthouse(url, undefined, undefined, page);
console.log(`Lighthouse scores: ${Object.values(lhr.categories).map(c => c.score).join(', ')}`);
await browser.disconnect();
chrome.kill();
```
---
# Source: https://github.com/GoogleChrome/lighthouse/blob/main/docs/readme.md
This directory contains useful documentation, examples (keep reading),
and [recipes](./recipes/) to get you started. For an overview of Lighthouse's
internals, see [Lighthouse Architecture](architecture.md).
## Using programmatically
The example below shows how to run Lighthouse programmatically as a Node module. It
assumes you've installed Lighthouse as a dependency (`yarn add --dev lighthouse`).
```js
import fs from 'fs';
import lighthouse from 'lighthouse';
import * as chromeLauncher from 'chrome-launcher';
const chrome = await chromeLauncher.launch({chromeFlags: ['--headless']});
const options = {logLevel: 'info', output: 'html', onlyCategories: ['performance'], port: chrome.port};
const runnerResult = await lighthouse('https://example.com', options);
// `.report` is the HTML report as a string
const reportHtml = runnerResult.report;
fs.writeFileSync('lhreport.html', reportHtml);
// `.lhr` is the Lighthouse Result as a JS object
console.log('Report is done for', runnerResult.lhr.finalDisplayedUrl);
console.log('Performance score was', runnerResult.lhr.categories.performance.score * 100);
chrome.kill();
```
### Performance-only Lighthouse run
Many modules consuming Lighthouse are only interested in the performance numbers.
You can limit the audits you run to a particular category or set of audits.
```js
const flags = {onlyCategories: ['performance']};
await lighthouse(url, flags);
```
You can also craft your own config (e.g. [experimental-config.js](https://github.com/GoogleChrome/lighthouse/blob/main/core/config/experimental-config.js)) for custom runs. Also see the [basic custom audit recipe](https://github.com/GoogleChrome/lighthouse/tree/main/docs/recipes/custom-audit).
### Differences from CLI flags
Note that some flag functionality is only available to the CLI. The set of shared flags that work in both node and CLI can be found [in our typedefs](https://github.com/GoogleChrome/lighthouse/blob/main/types/lhr/settings.d.ts#:~:text=interface%20SharedFlagsSettings). In most cases, the functionality is not offered in the node module simply because it is easier and more flexible to do it yourself.
| CLI Flag | Differences in Node |
| - | - |
| `port` | Only specifies which port to use, Chrome is not launched for you. |
| `chromeFlags` | Ignored, Chrome is not launched for you. |
| `outputPath` | Ignored, output is returned as string in `.report` property. |
| `saveAssets` | Ignored, artifacts are returned in `.artifacts` property. |
| `view` | Ignored, use the `open` npm module if you want this functionality. |
| `enableErrorReporting` | Ignored, error reporting is always disabled for node. |
| `listAllAudits` | Ignored, not relevant in programmatic use. |
| `listTraceCategories` | Ignored, not relevant in programmatic use. |
| `configPath` | Ignored, pass the config in as the 3rd argument to `lighthouse`. |
| `preset` | Ignored, pass the config in as the 3rd argument to `lighthouse`. |
| `verbose` | Ignored, use `logLevel` instead. |
| `quiet` | Ignored, use `logLevel` instead. |
### Turn on logging
If you want to see log output as Lighthouse runs, set an appropriate logging level in your code and pass
the `logLevel` flag when calling `lighthouse`.
```javascript
const flags = {logLevel: 'info'};
await lighthouse('https://example.com', flags);
```
## Configuration
In order to extend the Lighthouse configuration programmatically, you need to pass the config object as the 3rd argument. If omitted, a default configuration is used.
**Example:**
```js
{
extends: 'lighthouse:default',
settings: {
onlyAudits: [
'speed-index',
'interactive',
],
},
}
```
You can extend base configuration from [lighthouse:default](https://github.com/GoogleChrome/lighthouse/blob/main/core/config/default-config.js), or you can build up your own configuration from scratch to have complete control.
For more information on the types of config you can provide, see [Lighthouse Configuration](https://github.com/GoogleChrome/lighthouse/blob/main/docs/configuration.md).
## Testing on a site with authentication
When installed globally via `npm i -g lighthouse` or `yarn global add lighthouse`,
`chrome-debug` is added to your `PATH`. This binary launches a standalone Chrome
instance with an open debugging port.
1. Run `chrome-debug`. This will log the debugging port of your Chrome instance
1. Navigate to your site and log in.
1. In a separate terminal tab, run `lighthouse http://mysite.com --port port-number` using the port number from chrome-debug.
## Testing on a site with an untrusted certificate
When testing a site with an untrusted certificate, Chrome will be unable to load the page and so the Lighthouse report will mostly contain errors.
If this certificate **is one you control** and is necessary for development (for instance, `localhost` with a self-signed certificate for local HTTP/2 testing), we recommend you _add the certificate to your locally-trusted certificate store_. In Chrome, see `Settings` > `Privacy and Security` > `Manage certificates` or consult instructions for adding to the certificate store in your operating system.
Alternatively, you can instruct Chrome to ignore the invalid certificate by adding the Lighthouse CLI flag `--chrome-flags="--ignore-certificate-errors"`. However, you must be as careful with this flag as it's equivalent to browsing the web with TLS disabled. Any content loaded by the test page (e.g. third-party scripts or iframed ads) will *also* not be subject to certificate checks, [opening up avenues for MitM attacks](https://www.chromium.org/Home/chromium-security/education/tls#TOC-What-security-properties-does-TLS-give-me-). For these reasons, we recommend the earlier solution of adding the certificate to your local cert store.
## Testing on a mobile device
Lighthouse can run against a real mobile device. You can follow the [Remote Debugging on Android (Legacy Workflow)](https://developer.chrome.com/devtools/docs/remote-debugging-legacy) up through step 3.3, but the TL;DR is install & run adb, enable USB debugging, then port forward 9222 from the device to the machine with Lighthouse.
You'll likely want to use the CLI flags `--screenEmulation.disabled --throttling.cpuSlowdownMultiplier=1 --throttling-method=provided` to disable any additional emulation.
```sh
$ adb kill-server
$ adb devices -l
* daemon not running. starting it now on port 5037 *
* daemon started successfully *
00a2fd8b1e631fcb device usb:335682009X product:bullhead model:Nexus_5X device:bullhead
$ adb forward tcp:9222 localabstract:chrome_devtools_remote
$ lighthouse --port=9222 --screenEmulation.disabled --throttling.cpuSlowdownMultiplier=1 --throttling-method=provided https://example.com
```
## Lighthouse as trace processor
Lighthouse can be used to analyze trace and performance data collected from other tools (like WebPageTest and ChromeDriver). The `Trace` and `DevtoolsLog` artifact items can be provided using a string for the absolute path on disk if they're saved with `.trace.json` and `.devtoolslog.json` file extensions, respectively. The `DevtoolsLog` array is captured from the `Network` and `Page` domains (a la ChromeDriver's [enableNetwork and enablePage options](https://sites.google.com/a/chromium.org/chromedriver/capabilities#TOC-perfLoggingPrefs-object)).
As an example, here's a trace-only run that reports on user timings and critical request chains:
### `config.json`
```json
{
"settings": {
"auditMode": "/User/me/lighthouse/core/test/fixtures/artifacts/perflog/",
},
"audits": [
"user-timings",
"critical-request-chains"
],
"categories": {
"performance": {
"name": "Performance Metrics",
"description": "These encapsulate your web app's performance.",
"audits": [
{"id": "user-timings", "weight": 1},
{"id": "critical-request-chains", "weight": 1}
]
}
}
}
```
Then, run with: `lighthouse --config-path=config.json http://www.random.url`
---
# Source: https://github.com/GoogleChrome/lighthouse/blob/main/docs/recipes/custom-audit/readme.md
# Basic Custom Audit Recipe
> **Tip**: see [Lighthouse Architecture](../../../docs/architecture.md) for information
on terminology and architecture.
## What this example does
This example shows how to write a custom Lighthouse audit for a hypothetical search page. The page is considered fully initialized when the main search box (the page's "hero element") is ready to be used. When this happens, the page uses `performance.now()` to mark the time it took to become ready and saves the value in a global variable called `window.myLoadMetrics.searchableTime`.
## The Audit, Gatherer, and Config
- [searchable-gatherer.js](searchable-gatherer.js) - a [Gatherer](https://github.com/GoogleChrome/lighthouse/blob/main/docs/architecture.md#components--terminology) that collects `window.myLoadMetrics.searchableTime`
from the context of the page.
- [searchable-audit.js](searchable-audit.js) - an [Audit](https://github.com/GoogleChrome/lighthouse/blob/main/docs/architecture.md#components--terminology) that tests whether or not `window.myLoadMetrics.searchableTime`
stays below a 4000ms threshold. In other words, Lighthouse will consider the audit "passing"
in the report if the search box initializes within 4s.
- [custom-config.js](custom-config.js) - this file tells Lighthouse where to
find the gatherer and audit files, when to run them, and how to incorporate their
output into the Lighthouse report. This example extends [Lighthouse's
default configuration](https://github.com/GoogleChrome/lighthouse/blob/main/core/config/default-config.js).
**Note**: when extending the default configuration file, all arrays will be concatenated and primitive values will override the defaults.
## Run the configuration
Run Lighthouse with the custom audit by using the `--config-path` flag with your configuration file:
```sh
lighthouse --config-path=custom-config.js https://example.com
```
---
# Source: https://github.com/GoogleChrome/lighthouse/blob/main/docs/recipes/custom-gatherer-puppeteer/readme.md
# Using Puppeteer in a Gatherer
> **Tip**: see [Basic Custom Audit Recipe](../custom-audit) for basic information about custom audits.
```sh
lighthouse --config-path=custom-config.js https://www.example.com
```
---
# Source: https://github.com/GoogleChrome/lighthouse/blob/main/docs/recipes/lighthouse-plugin-example/readme.md
# Lighthouse plugin recipe
The result of this guide can be found at our [Lighthouse Plugin GitHub repository template](https://github.com/GoogleChrome/lighthouse-plugin-example)
## Contents
- `package.json` - declares the plugin's entry point (`plugin.js`)
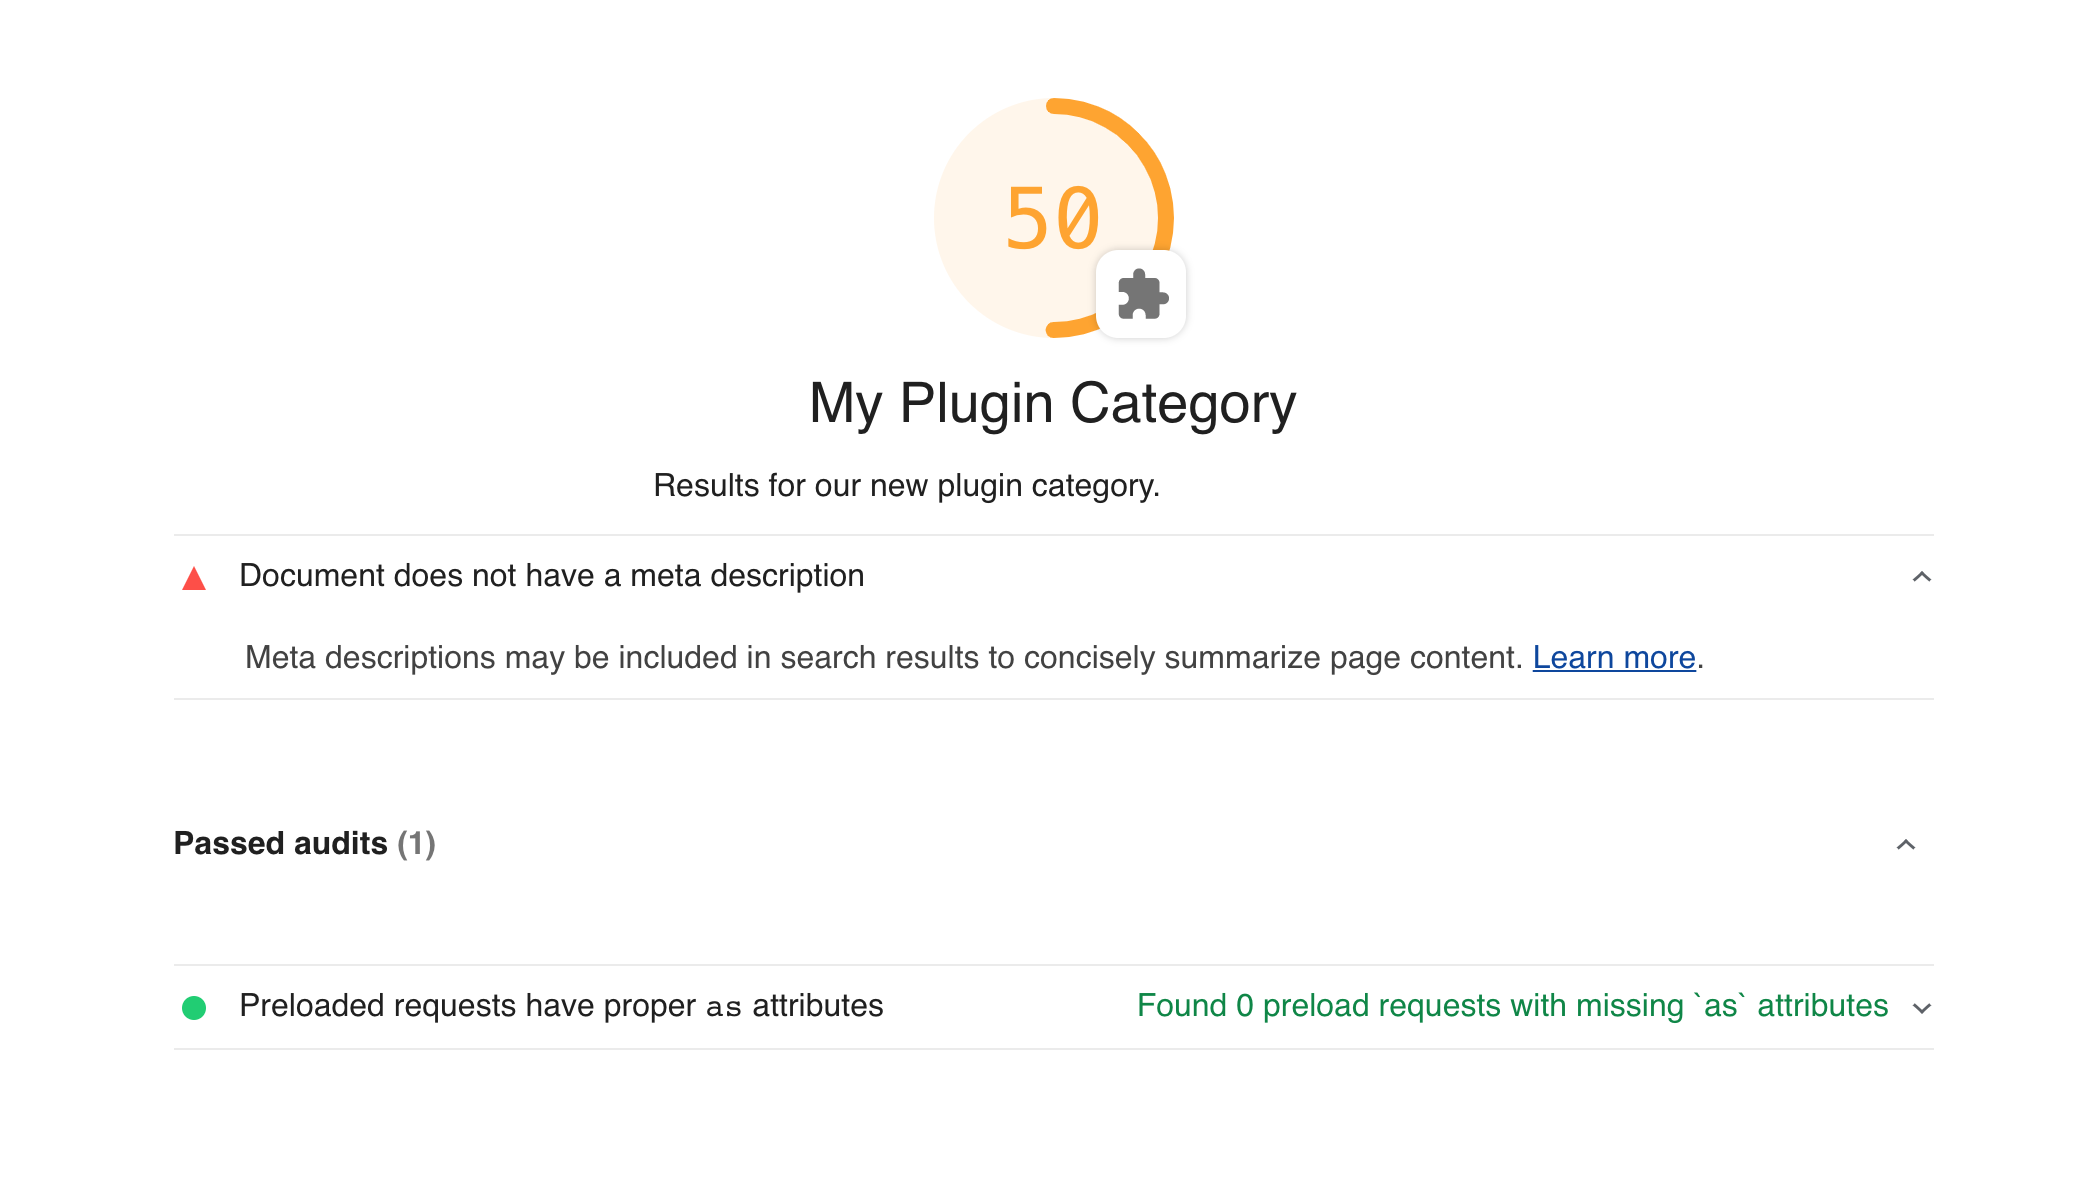
- `plugin.js` - instructs Lighthouse to run the plugin's own `preload-as.js` audit; describes the new category and its details for the report
- `audits/preload-as.js` - the new audit to run in addition to Lighthouse's default audits
## To develop as a plugin developer
Run the following to start of with the recipe as a template:
```sh
mkdir lighthouse-plugin-example && cd lighthouse-plugin-example
curl -L https://github.com/GoogleChrome/lighthouse/archive/main.zip | tar -xzv
mv lighthouse-main/docs/recipes/lighthouse-plugin-example/* ./
rm -rf lighthouse-main
```
Install and run just your plugin:
```sh
yarn
NODE_PATH=.. npx lighthouse -- https://example.com --plugins=lighthouse-plugin-example --only-categories=lighthouse-plugin-example --view
```
When you rename the plugin, be sure to rename its directory as well.
### Iterating
To speed up development, you can gather once and iterate by auditing repeatedly.
```sh
# Gather artifacts from the browser
NODE_PATH=.. npx lighthouse -- https://example.com --plugins=lighthouse-plugin-example --only-categories=lighthouse-plugin-example --gather-mode
# and then iterate re-running this:
NODE_PATH=.. npx lighthouse -- https://example.com --plugins=lighthouse-plugin-example --only-categories=lighthouse-plugin-example --audit-mode --view
```
Finally, publish to NPM.
## To run as a plugin user
1. Install `lighthouse` (v5+) and the plugin `lighthouse-plugin-example`, likely as `devDependencies`.
* `npm install -D lighthouse lighthouse-plugin-example`
1. To run your private lighthouse binary, you have three options
1. `npx --no-install lighthouse -- https://example.com --plugins=lighthouse-plugin-example --view`
1. `yarn lighthouse https://example.com --plugins=lighthouse-plugin-example --view`
1. Add an npm script calling `lighthouse` and run that.
## Result

---
# Source: https://github.com/GoogleChrome/lighthouse/blob/main/docs/recipes/type-checking/readme.md
# Lighthouse type checking recipe
This example project demonstrates how Lighthouse types can be imported into a node project.
`use-types.ts` is a basic user flow script that takes advantage of Lighthouse types and integrates with the version of Puppeteer installed.
---
# Source: https://github.com/GoogleChrome/lighthouse/blob/main/docs/releasing.md
### Release guide for maintainers
This doc is only relevant to core members.
## Release Policy
### Cadence
We aim to release every 4 week, one day after the [expected Chromium branch point](https://www.chromium.org/developers/calendar). These are Wednesdays.
Major version bumps will be the first release of April and October. The due date and progress of major milestones are tracked in https://github.com/GoogleChrome/lighthouse/milestones.
For example, following this schedule, we will attempt a release on these dates:
* _Sep 6 2023_ (Ships in M119, after M118 branch point)
* _Oct 4 2023_ (Ships in M120, after M119 branch point)
* ...
The planned ship dates are added to the internal Lighthouse calendar.
If a release is necessary outside these scheduled dates, we may choose to skip the next scheduled release.
In general, the above release dates are when new versions will be available in npm. Within 2 weeks, it will be reflected in LR / PSI. Some 10 weeks later, it will be available in Stable Chrome.
### Release manager
Release manager is appointed, according to the list below. However, if the appointed manager is absent, the next engineer in line in the list would own it.
@cjamcl, @adamraine
### Versioning
We follow [semver](https://semver.org/) versioning semantics (`vMajor.Minor.Patch`). Breaking changes will bump the major version. New features or bug fixes will bump the minor version. If a release contains no new features, then we'll only bump the patch version.
## Release Process
### Update various dependencies
In general, Lighthouse should be using the latest version of its critical dependencies. These are listed in the following script. It's ok to not be on the very latest, use your judgement.
```sh
# first, ask Paul to publish chrome-devtools-frontend
bash core/scripts/upgrade-deps.sh
```
### On the scheduled release date
Before starting, you should announce to the LH eng channel that you are releasing,
and that no new PRs should be merged until you are done.
### Lightrider
There is a cron that rolls the latest Lighthouse to the Lightrider canary feed.
Make sure it has run recently, and there were no errors that require an upstream
fix in Lighthouse
For more, see the internal README for updating Lighthouse: go/lightrider-doc
Hold on submitting a CL until after cutting a release.
### Open the PR
Now that the integrations are confirmed to work, go back to `lighthouse` folder.
```sh
# Prepare the commit, replace x.x.x with the desired version
bash ./core/scripts/release/prepare-commit.sh x.x.x
```
1. Edit changelog.md before opening the PR
1. Open the PR with title `vx.x.x`
1. Hold until approved and merged
### Cut the release
```sh
# Package everything for publishing.
bash ./core/scripts/release/prepare-package.sh
# Make sure you're in the Lighthouse pristine repo.
cd ../lighthouse-pristine
# Last chance to abort.
git status
git log
# Publish tag.
git push --tags
# Publish to npm.
npm publish
# Publish viewer and treemap.
yarn deploy-viewer
yarn deploy-treemap
```
### Extensions
The extensions rarely change. Run `git log clients/extension` to see the latest changes,
and re-publish them to the Chrome and Firefox extension stores if necessary.
To test:
- run `yarn build-extension`
- go to chrome://extensions/
- click "load packed", select `dist/extension-chrome-package`
- manually test it
To publish:
```sh
# Publish the extensions (if it changed).
open https://chrome.google.com/webstore/developer/edit/blipmdconlkpinefehnmjammfjpmpbjk
cd dist/extension-package/
echo "Upload the package zip to CWS dev dashboard..."
# Be in lighthouse-extension-owners group
# Open <https://chrome.google.com/webstore/developer/dashboard>
# Click _Edit_ on lighthouse
# _Upload Updated Package_
# Select `lighthouse-X.X.X.X.zip`
# _Publish_ at the bottom
# For Firefox: https://addons.mozilla.org/en-US/developers/addon/google-lighthouse/versions/submit/
```
### Chromium CL
```sh
git checkout vx.x.x # Checkout the specific version.
yarn devtools ~/src/devtools/devtools-frontend
cd ~/src/devtools/devtools-frontend
git new-branch rls
git commit -am "[Lighthouse] Roll Lighthouse x.x.x"
git cl upload -b 40543651
```
### Lightrider
Roll to Lightrider canary, and alert LR team that the next version is ready to be rolled to stable.
### Done
Yay!
---
# Source: https://github.com/GoogleChrome/lighthouse/blob/main/docs/running-at-scale.md
# Running Lighthouse at Scale
Many Lighthouse users want to collect Lighthouse data for hundreds or thousands of URLs daily. First, anyone interested should understand [how variability plays into web performance measurement](./variability.md) in the lab.
There are three primary options for gathering Lighthouse data at scale.
## Option 1: Using the PSI API
The default quota of the [PageSpeed Insights API](https://developers.google.com/speed/docs/insights/v5/get-started) is 25,000 requests per day. Of course, you can't test localhost or firewalled URLs using the PSI API, unless you use a security-concerning solution like [ngrok](https://ngrok.com/) to web-expose them.
A huge benefit of using the PSI API is that you don't need to create and maintain [a stable testing environment](./variability.md#run-on-adequate-hardware) for Lighthouse to run. The PSI API has Lighthouse running on Google infrastructure which offers good reproducibility.
* PRO: You don't need to maintain testing hardware.
* PRO: A simple network request returns complete Lighthouse results
* CON: The URLs must be web-accessible.
Approx eng effort: ~5 minutes for the first result. ~30 minutes for a script that evaluates and saves the results for hundreds of URLs.
## Option 2: Using the Lighthouse CLI on cloud hardware
The [Lighthouse CLI](https://github.com/GoogleChrome/lighthouse#using-the-node-cli) is the foundation of most advanced uses of Lighthouse and provides considerable configuration possibilities. For example, you could launch a fresh Chrome in a debuggable state (`chrome-debug --port=9222`) and then have Lighthouse repeatedly reuse the same Chrome. (`lighthouse <url> --port=9222`). That said, we wouldn't recommend this above a hundred loads, as state can accrue in a Chrome profile. Using a fresh profile for each Lighthouse run is the best approach for reproducible results.
Many teams have wrapped around the Lighthouse CLI with bash, python, or node scripts. The npm modules [multihouse](https://github.com/samdutton/multihouse) and [lighthouse-batch](https://www.npmjs.com/package/lighthouse-batch) both leverage this pattern.
You'll be running Lighthouse CLI on your own machines, and we have guidance on the [specs of machines suitable](./variability.md#run-on-adequate-hardware) for running Lighthouse without skewing performance results. The environment must also be able to run either headful Chrome or headless Chrome.
* PRO: Ultimate configurability
* CON: Must create and maintain testing environment
Approx eng effort: 1 day for the first result, after provisioning and setup. Another 2-5 days for calibrating, troubleshooting, handling interaction with cloud machines.
## Option 3: Gather data via a service that integrates Lighthouse
Many are listed in our readme: https://github.com/GoogleChrome/lighthouse#lighthouse-integrations-in-web-perf-services
---
# Source: https://github.com/GoogleChrome/lighthouse/blob/main/docs/scoring.md
# Lighthouse Scores
## How is the Performance score calculated?
➡️ Please read [Lighthouse Performance Scoring at developer.chrome.com](https://developer.chrome.com/docs/lighthouse/performance/performance-scoring/).
## How is the Best Practices score calculated?
All audits in the Best Practices category are equally weighted. Therefore, implementing each audit correctly will increase your overall score by ~6 points.
## How is the SEO score calculated?
All audits in the SEO category are [equally weighted](https://github.com/GoogleChrome/lighthouse/blob/main/core/config/default-config.js#:~:text=%7D%2C-,%27seo%27%3A,-%7B), with the exception of Structured Data, which is an unscored manual audit. Therefore, implementing each audit correctly will increase your overall score by ~8 points.
## How is the accessibility score calculated?
<!-- To regnerate score weights, run `node core/scripts/print-a11y-scoring.js`-->
The accessibility score is a weighted average. The specific weights for v7 are as follows:
(See the [v6 scoring explanation](https://github.com/GoogleChrome/lighthouse/blob/v6.5.0/docs/scoring.md#how-is-the-accessibility-score-calculated))
| audit id | weight |
|-|-|
| aria-allowed-attr | 4.1% |
| aria-hidden-body | 4.1% |
| aria-required-attr | 4.1% |
| aria-required-children | 4.1% |
| aria-required-parent | 4.1% |
| aria-roles | 4.1% |
| aria-valid-attr-value | 4.1% |
| aria-valid-attr | 4.1% |
| button-name | 4.1% |
| duplicate-id-aria | 4.1% |
| image-alt | 4.1% |
| input-image-alt | 4.1% |
| label | 4.1% |
| meta-refresh | 4.1% |
| meta-viewport | 4.1% |
| video-caption | 4.1% |
| accesskeys | 1.2% |
| aria-command-name | 1.2% |
| aria-hidden-focus | 1.2% |
| aria-input-field-name | 1.2% |
| aria-meter-name | 1.2% |
| aria-progressbar-name | 1.2% |
| aria-toggle-field-name | 1.2% |
| aria-tooltip-name | 1.2% |
| aria-treeitem-name | 1.2% |
| bypass | 1.2% |
| color-contrast | 1.2% |
| definition-list | 1.2% |
| dlitem | 1.2% |
| document-title | 1.2% |
| duplicate-id-active | 1.2% |
| frame-title | 1.2% |
| html-has-lang | 1.2% |
| html-lang-valid | 1.2% |
| link-name | 1.2% |
| list | 1.2% |
| listitem | 1.2% |
| object-alt | 1.2% |
| tabindex | 1.2% |
| td-headers-attr | 1.2% |
| th-has-data-cells | 1.2% |
| valid-lang | 1.2% |
| form-field-multiple-labels | 0.8% |
| heading-order | 0.8% |
Each audit is a pass/fail, meaning there is no room for partial points for getting an audit half-right. For example, that means if half your buttons have screenreader friendly names, and half do not, you don't get "half" of the weighted average - you get a 0 because it needs to be implemented correctly *throughout* the page.
---
# Source: https://github.com/GoogleChrome/lighthouse/blob/main/docs/throttling.md
# Network Throttling
Lighthouse applies network throttling to emulate the ~85th percentile mobile connection speed even when run on much faster fiber connections.
## The mobile network throttling preset
This is the standard recommendation for mobile throttling:
- Latency: 150ms
- Throughput: 1.6Mbps down / 750 Kbps up.
- Packet loss: none.
These exact figures are [defined in the Lighthouse constants](https://github.com/GoogleChrome/lighthouse/blob/main/core/config/constants.js#:~:text=of%204G%20connections.-,mobileSlow4G,-%3A%20%7B) and used as Lighthouse's throttling default.
They represent roughly the bottom 25% of 4G connections and top 25% of 3G connections (in Lighthouse this configuration is currently called "Slow 4G" but used to be labeled as "Fast 3G").
This preset is identical to the [WebPageTest's "Mobile 3G - Fast"](https://github.com/WPO-Foundation/webpagetest/blob/master/www/settings/connectivity.ini.sample) and, due to a lower latency, slightly faster for some pages than the [WebPageTest "4G" preset](https://github.com/WPO-Foundation/webpagetest/blob/master/www/settings/connectivity.ini.sample).
## Types of network throttling
Within web performance testing, there are four typical styles of network throttling:
1. **_Simulated throttling_**, which Lighthouse uses by **default**, uses a simulation of a page load, based on the data observed in the initial unthrottled load. This approach makes it both very fast and deterministic. However, due to the imperfect nature of predicting alternate execution paths, there is inherent inaccuracy that is summarized in this doc: [Lighthouse Metric Variability and Accuracy](https://docs.google.com/document/d/1BqtL-nG53rxWOI5RO0pItSRPowZVnYJ_gBEQCJ5EeUE/edit). The TLDR: while it's roughly as accurate or better than DevTools throttling for most sites, it suffers from edge cases and a deep investigation to performance should use _Packet-level_ throttling tools.
1. **_Request-level throttling_** , also referred to as **_DevTools throttling_** in the Lighthouse panel or _`devtools` throttling_ in Lighthouse configuration, is how throttling is implemented with Chrome DevTools. In real mobile connectivity, latency affects things at the packet level rather than the request level. As a result, this throttling isn't highly accurate. It also has a few more downsides that are summarized in [Network Throttling & Chrome - status](https://docs.google.com/document/d/1TwWLaLAfnBfbk5_ZzpGXegPapCIfyzT4MWuZgspKUAQ/edit). The TLDR: while it's a [decent approximation](https://docs.google.com/document/d/10lfVdS1iDWCRKQXPfbxEn4Or99D64mvNlugP1AQuFlE/edit), it's not a sufficient model of a slow connection. The [multipliers used in Lighthouse](https://github.com/GoogleChrome/lighthouse/blob/main/core/config/constants.js#:~:text=*%201024%2C-,requestLatencyMs,-%3A%20150%20*) attempt to correct for the differences.
1. **_Proxy-level_** throttling tools do not affect UDP data, so they're decent, but not ideal.
1. **_Packet-level_** throttling tools are able to make the most accurate network simulation. While this approach can model real network conditions most effectively, it also can introduce [more variance](https://docs.google.com/document/d/1BqtL-nG53rxWOI5RO0pItSRPowZVnYJ_gBEQCJ5EeUE/edit) than request-level or simulated throttling. [WebPageTest uses](https://github.com/WPO-Foundation/wptagent/blob/master/docs/remote_trafficshaping.md) packet-level throttling.
Lighthouse, by default, uses simulated throttling as it provides both quick evaluation and minimized variance. However, some may want to experiment with more accurate throttling... [Learn more about these throttling types and how they behave in in different scenarios](https://www.debugbear.com/blog/network-throttling-methods).
## DevTools' Lighthouse Panel Throttling
The Lighthouse panel has a simplified throttling setup:
1. _Simulated throttling_ remains the default setting. This matches the setup of PageSpeed Insights and the Lighthouse CLI default, maintaining cross-tool consistency.
- If you click the `View Original Trace` button, the trace values will not match up with Lighthouse's metric results, as the original trace is prior to the simulation.
1. _DevTools throttling_ is available within the Lighthouse panel settings (⚙): select _DevTools throttling_ from the throttling method dropdown.
- In this mode, the performance data seen after clicking the [`View Trace` button](https://developers.google.com/web/updates/2018/04/devtools#traces) will match Lighthouses's numbers.
Of course, CLI users can still control the exact [configuration](../readme.md#cli-options) of throttling.
## How do I get packet-level throttling?
This Performance Calendar article, [Testing with Realistic Networking Conditions](https://calendar.perfplanet.com/2016/testing-with-realistic-networking-conditions/), has a good explanation of packet-level traffic shaping (which applies across TCP/UDP/ICMP) and recommendations.
The [`@sitespeed.io/throttle`](https://www.npmjs.com/package/@sitespeed.io/throttle) npm package appears to be the most usable Mac/Linux commandline app for managing your network connection. Important to note: it changes your **entire** machine's network interface. Also, **`@sitespeed.io/throttle` requires `sudo`** (as all packet-level shapers do).
**Windows?** As of today, there is no single cross-platform tool for throttling. But there are two recommended **Windows 7** network shaping utilities: [WinShaper](https://calendar.perfplanet.com/2016/testing-with-realistic-networking-conditions/#introducing_winshaper) and [Clumsy](http://jagt.github.io/clumsy/).
For **Windows 10** [NetLimiter](https://www.netlimiter.com/buy/nl4lite/standard-license/1/0) (Paid option) and [TMeter](http://www.tmeter.ru/en/) (Freeware Edition) are the most usable solutions.
### `@sitespeed.io/throttle` set up
```sh
# Install with npm
npm install @sitespeed.io/throttle -g
# Ensure you have Node.js installed and npm is in your $PATH (https://nodejs.org/en/download/)
# To use the recommended throttling values:
throttle --up 768 --down 1638 --rtt 150
# or even simpler (using a predefined profile)
throttle 3gfast
# To disable throttling
throttle --stop
```
For more information and a complete list of features visit the documentation on [sitespeed.io website](https://www.sitespeed.io/documentation/throttle/).
### Using Lighthouse with `@sitespeed.io/throttle`
```sh
npm install @sitespeed.io/throttle -g
# Enable system traffic throttling
throttle 3gfast
# Run Lighthouse with its own network throttling disabled (while leaving CPU throttling)
lighthouse --throttling-method=devtools \
--throttling.requestLatencyMs=0 \
--throttling.downloadThroughputKbps=0 \
--throttling.uploadThroughputKbps=0 \
https://example.com
# Disable the traffic throttling once you see "Gathering trace"
throttle --stop
```
# CPU Throttling
Lighthouse applies CPU throttling to emulate a mid-tier mobile device even when run on far more powerful desktop hardware.
## Benchmarking CPU Power
Unlike network throttling where objective criteria like RTT and throughput allow targeting of a specific environment, CPU throttling is expressed relative to the performance of the host device. This poses challenges to [variability in results across devices](./variability.md), so it's important to calibrate your device before attempting to compare different reports.
Lighthouse computes and saves a `benchmarkIndex` as a rough approximation of the host device's CPU performance with every report. You can find this value under the title "CPU/Memory Power" at the bottom of the Lighthouse report:
<img src="https://user-images.githubusercontent.com/2301202/96950078-1b03d380-14af-11eb-9583-fbf8133315b2.png" alt="Screenshot of CPU/Memory Power in Lighthouse report" width=600 border=1 />
**NOTE:** In Lighthouse 6.3 BenchmarkIndex changed its definition to better align with changes in Chrome 86. Benchmark index values prior to 6.3 and Chrome 86 may differ.
Below is a table of various device classes and their approximate ranges of `benchmarkIndex` as of Chrome m86 along with a few other benchmarks. The amount of variation in each class is quite high. Even the same device can be purchased with multiple different processors and memory options.
| - | High-End Desktop | Low-End Desktop | High-End Mobile | Mid-Tier Mobile | Low-End Mobile |
| ----------------------------------- | ---------------- | --------------- | --------------- | --------------- | ----------------- |
| Example Device | 16" Macbook Pro | Intel NUC i3 | Samsung S10 | Moto G4 | Samsung Galaxy J2 |
| **Lighthouse BenchmarkIndex** | 1500-2000 | 1000-1500 | 800-1200 | 125-800 | <125 |
| Octane 2.0 | 30000-45000 | 20000-35000 | 15000-25000 | 2000-20000 | <2000 |
| Speedometer 2.0 | 90-200 | 50-90 | 20-50 | 10-20 | <10 |
| JavaScript Execution of a News Site | 2-4s | 4-8s | 4-8s | 8-20s | 20-40s |
## Calibrating the CPU slowdown
By default, Lighthouse uses **a constant 4x CPU multiplier** which moves a typical run in the high-end desktop bracket somewhere into the mid-tier mobile bracket.
You may choose to calibrate if your benchmarkIndex is in a different range than the above table would expect. Additionally, when Lighthouse is run from the CLI with default settings on an underpowered device, a warning will be added to the report suggesting you calibrate the slowdown:

The `--throttling.cpuSlowdownMultiplier` CLI flag allows you to configure the throttling level applied. On a weaker machine, you can lower it from the default of 4x to something more appropriate.
The [Lighthouse CPU slowdown calculator webapp](https://lighthouse-cpu-throttling-calculator.vercel.app/) will compute what multiplier to use from the `CPU/Memory Power` value from the bottom of the report.
<a href="https://lighthouse-cpu-throttling-calculator.vercel.app/">
<img src="https://user-images.githubusercontent.com/39191/101436708-8a991b00-38c3-11eb-89c5-7d43752932e9.png" width=300>
</a>
Alternatively, consider the below table of the various `cpuSlowdownMultiplier`s you might want to use to target different devices along with the possible range:
| - | High-End Desktop | Low-End Desktop | High-End Mobile | Mid-Tier Mobile | Low-End Mobile |
| ---------------- | ---------------- | --------------- | --------------- | --------------- | -------------- |
| High-End Desktop | 1x | 2x (1-4) | 2x (1-4) | 4x (2-10) | 10x (5-20) |
| Low-End Desktop | - | 1x | 1x | 2x (1-5) | 5x (3-10) |
| High-End Mobile | - | - | 1x | 2x (1-5) | 5x (3-10) |
| Mid-Tier Mobile | - | - | - | 1x | 2x (1-5) |
| Low-End Mobile | - | - | - | - | 1x |
If your device's BenchmarkIndex falls on the _higher_ end of its bracket, use a _higher_ multiplier from the range in the table. If your device's BenchmarkIndex falls on the _lower_ end of its bracket, use a _lower_ multiplier from the range in the table. If it's somewhere in the middle, use the suggested multiplier.
```bash
# Run Lighthouse with a custom CPU slowdown multiplier
lighthouse --throttling.cpuSlowdownMultiplier=6 https://example.com
```
## Types of CPU Throttling
Within web performance testing, there are two typical styles of CPU throttling:
1. **_Simulated throttling_**, which Lighthouse uses by **default**, uses a simulation of a page load, based on the data observed in the initial unthrottled load. This approach makes it very fast. However, due to the imperfect nature of predicting alternate execution paths, there is inherent inaccuracy that is summarized in this doc: [Lighthouse Metric Variability and Accuracy](https://docs.google.com/document/d/1BqtL-nG53rxWOI5RO0pItSRPowZVnYJ_gBEQCJ5EeUE/edit). The TLDR: while it's fairly accurate for most circumstances, it suffers from edge cases and a deep investigation to performance should use _DevTools_ CPU throttling tools.
1. **_DevTools throttling_** , also called _`devtools` throttling_ in Lighthouse configuration. This method actually interrupts execution of CPU work at periodic intervals to emulate a slower processor. It is [fairly accurate](https://docs.google.com/document/d/1jGHeGjjjzfTAE2WHXipKF3aqwF2bFA6r0B877nFtBpc/edit) and much easier than obtaining target hardware. The same underlying principle can be used by [linux cgroups](https://www.kernel.org/doc/html/latest/scheduler/sched-bwc.html) to throttle any process, not just the browser. Other tools like [WebPageTest use CPU throttling](https://github.com/WPO-Foundation/wptagent/commit/f7fe0d6b5b01bd1b042a1fe3144c68a6bff846a6) offered by DevTools.
---
# Source: https://github.com/GoogleChrome/lighthouse/blob/main/docs/understanding-results.md
# Understanding the Results
The result object contains all the audit information Lighthouse determined about the page. In fact, everything you see in the HTML report, even the screenshots, is a rendering of information contained in the result object. You might need to work directly with the result object if you use [Lighthouse programmatically](https://github.com/GoogleChrome/lighthouse/blob/main/docs/readme.md#using-programmatically), consume the JSON output of the [CLI](https://github.com/GoogleChrome/lighthouse#using-the-node-cli), explore [Lighthouse results in HTTPArchive](https://github.com/GoogleChrome/lighthouse#lighthouse-integrations), or work on the report generation code that reads the Lighthouse JSON and outputs HTML.
## Lighthouse Result Object (LHR)
The top-level Lighthouse Result object (LHR) is what the lighthouse node module returns and the entirety of the JSON output of the CLI. It contains some metadata about the run and the results in the various subproperties below.
For an always up-to-date definition of the LHR, take a look [at our typedefs](https://github.com/GoogleChrome/lighthouse/blob/main/types/lhr/lhr.d.ts).
### Properties
| Name | Description |
| - | - |
| lighthouseVersion | The version of Lighthouse with which this result was generated. |
| fetchTime | The ISO-8601 timestamp of when the result was generated. |
| userAgent | The user agent string of the version of Chrome that was used by Lighthouse. |
| requestedUrl | The URL that was supplied to Lighthouse and initially navigated to. |
| mainDocumentUrl | The URL of the main document request during the final page navigation. |
| finalDisplayedUrl | The URL displayed on the page after all redirects, history API updates, etc. |
| [audits](#audits) | An object containing the results of the audits. |
| [configSettings](#config-settings) | An object containing information about the configuration used by Lighthouse. |
| [timing](#timing) | An object containing information about how long Lighthouse spent auditing. |
| [categories](#categories) | An object containing the different categories, their scores, and references to the audits that comprise them. |
| [categoryGroups](#category-groups) | An object containing the display groups of audits for the report. |
| runtimeError | An object `{code: string, message: string};` providing a top-level error message that, if present, indicates a serious enough problem that this Lighthouse result may need to be discarded. |
| runWarnings | Array of top-level warnings for this Lighthouse run. |
### Example
```json
{
"lighthouseVersion": "5.1.0",
"fetchTime": "2019-05-05T20:50:54.185Z",
"userAgent": "Mozilla/5.0 (Macintosh; Intel Mac OS X 10_13_3) AppleWebKit/537.36 (KHTML, like Gecko) Chrome/66.0.3358.0 Safari/537.36",
"requestedUrl": "http://example.com",
"mainDocumentUrl": "https://www.example.com/",
"finalDisplayedUrl": "https://www.example.com/",
"audits": {...},
"configSettings": {...},
"timing": {...},
"categories": {...},
"categoryGroups": {...},
}
```
<a name="audits"></a>
## `audits`
An object containing the results of the audits, keyed by their name.
### Audit Properties
| Name | Type | Description |
| -- | -- | -- |
| id | `string` | The string identifier of the audit in kebab case. |
| title | `string` | The display name of the audit. The text can change depending on if the audit passed or failed. It may contain markdown code. |
| description | `string` | A more detailed description that describes why the audit is important and links to Lighthouse documentation on the audit, markdown links supported. |
| explanation | <code>string|undefined</code> | A string indicating the reason for audit failure. |
| warnings | <code>string[]|undefined</code> | Messages identifying potentially invalid cases |
| errorMessage | <code>string|undefined</code> | A message set |
| numericValue | <code>number|undefined</code> | The unscored value determined by the audit. Typically this will match the score if there's no additional information to impart. For performance audits, this value is typically a number indicating the metric value. |
| displayValue | <code>string|undefined</code> | The string to display in the report alongside audit results. If empty, nothing additional is shown. This is typically used to explain additional information such as the number and nature of failing items. |
| score | <code>number|null</code> | The scored value determined by the audit provided in the numeric range `0-1`, or null if `scoreDisplayMode` indicates not scored. |
| scoreDisplayMode | <code>"binary" | "numeric" | "error" | "manual" | "notApplicable" | "informative"</code> | A string identifying how the score should be interpreted for display i.e. is the audit pass/fail (score of 1 or 0), did it fail, should it be ignored, or are there shades of gray (scores between 0-1 inclusive). If set as `informative`, `notApplicable`, `manual`, or `error`, then `score` will be null and should be ignored. |
| details | `Object` | Extra information found by the audit necessary for display. The structure of this object varies from audit to audit. The [structure of this object](https://github.com/GoogleChrome/lighthouse/blob/main/types/lhr/audit-details.d.ts) is somewhat stable between minor version bumps as this object is used to render the HTML report. |
### Example
```json
{
"is-on-https": {
"id": "is-on-https",
"title": "Does not use HTTPS",
"description": "All sites should be protected with HTTPS, even ones that don't handle sensitive data. HTTPS prevents intruders from tampering with or passively listening in on the communications between your app and your users, and is a prerequisite for HTTP/2 and many new web platform APIs. [Learn more](https://developers.google.com/web/tools/lighthouse/audits/https).",
"score": 0,
"scoreDisplayMode": "binary",
"displayValue": "1 insecure request found",
"details": {
"type": "table",
"headings": [
{
"key": "url",
"valueType": "url",
"label": "Insecure URL"
}
],
"items": [
{
"url": "http://ajax.googleapis.com/ajax/libs/jquery/2.1.1/jquery.min.js"
}
]
}
},
},
"custom-audit": {
"name": "custom-audit",
...
}
}
```
<a name="config-settings"></a>
## `configSettings`
An object containing information about the configuration used by Lighthouse.
### Example
```json
{
"output": [
"json"
],
"maxWaitForLoad": 45000,
"throttlingMethod": "devtools",
"throttling": {
"rttMs": 150,
"throughputKbps": 1638.4,
"requestLatencyMs": 562.5,
"downloadThroughputKbps": 1474.5600000000002,
"uploadThroughputKbps": 675,
"cpuSlowdownMultiplier": 4
},
"gatherMode": false,
"disableStorageReset": false,
"formFactor": "mobile",
"blockedUrlPatterns": null,
"additionalTraceCategories": null,
"extraHeaders": null,
"onlyAudits": null,
"onlyCategories": null,
"skipAudits": null
}
```
<a name="timing"></a>
## `timing`
An object containing information about how long Lighthouse spent auditing.
### Properties
| Name | Type | Description |
| -- | -- | -- |
| total | `number` | The total time spent in milliseconds loading the page and evaluating audits. |
### Example
```json
{
"total": 32189
}
```
<a name="categories"></a>
## `categories`
An array containing the different categories, their scores, and the results of the audits in the categories.
### CategoryEntry Properties
| Name | Type | Description |
| -- | -- | -- |
| id | `string` | The string identifier of the category. |
| title | `string` | The human-friendly display name of the category. |
| description | `string` | A brief description of the purpose of the category, supports markdown links. |
| score | `number` | The overall score of the category, the weighted average of all its audits. |
| auditRefs | `AuditEntry[]` | An array of all the audit results in the category. |
### AuditEntry Properties
| Name | Type | Description |
| -- | -- | -- |
| id | `string` | The string identifier of the category. |
| weight | `number` | The weight of the audit's score in the overall category score. |
| group | `string` | |
### Example
```json
{
"seo": {
"id": "seo",
"title": "SEO",
"description": "These checks ensure that your page is following basic search engine optimization advice...",
"score": 0.54,
"auditRefs": [
{
"id": "crawlable-anchors",
"weight": 1
}
]
}
}
```
<a name="category-groups"></a>
## `categoryGroups`
An object containing the display groups of audits for the report, keyed by the group ID found in the config.
### GroupEntry Properties
| Name | Type | Description |
| -- | -- | -- |
| title | `string` | The title of the display group. |
| description | `string` | A brief description of the purpose of the display group. |
### Example
```json
{
"metrics": {
"title": "Metrics",
"description": "These metrics are super cool."
},
}
```
---
# Source: https://github.com/GoogleChrome/lighthouse/blob/main/docs/user-flows.md
# User Flows in Lighthouse
Historically, Lighthouse has analyzed the cold pageload of a page. Starting in 2022 (Lighthouse v10), it can analyze and report on the entire page lifecycle via "user flows".
#### You might be interested in flows if…
* … you want to run Lighthouse on your whole webapp, not just the landing page.
* … you want to know if all parts of the web experience are accessible (e.g. a checkout process).
* … you want to know the Cumulative Layout Shift of my SPA page transition
In these cases, you want Lighthouse on a _flow_, not just a page load.
## The three modes: Navigation, Timespan, Snapshot
Lighthouse can now run in three modes: navigations, timespans, and snapshots. Each mode has its own unique use cases, benefits, and limitations. Later, you'll create a flow by combining these three core report types.
* **Navigation mode** analyzes a single page load. It should feel familiar as all Lighthouse runs prior to v9.6.0 were essentially in this mode. Even in v9.6.0 and onwards, it remains the default.
* **Timespan mode** analyzes an arbitrary period of time, typically containing user interactions.
* **Snapshot mode** analyzes the page in a particular state.
| | |
|:---:|---|
| Navigation <br> <img src="https://user-images.githubusercontent.com/39191/170560057-4f7cab97-ee6b-497f-8e18-1f84ba3616dd.png" height="96" width="141"> | **Use Cases** <br> ✅ Obtain a Lighthouse Performance score and all performance metrics.<br>✅ Assess Progressive Web App capabilities.<br>✅ Analyze accessibility immediately after page load.<br><br> **Limitations** <br> 🤔 Cannot analyze form submissions or single page app transitions.<br>🤔 Cannot analyze content that isn't available immediately on page load. |
| Timespan <br> <img src="https://user-images.githubusercontent.com/39191/170560055-fb599418-c94d-44bf-9921-be4dce6abccf.png" height="96" width="141"> | **Use Cases** <br> ✅ Measure layout shifts and JavaScript execution time over a timerange including interactions.<br>✅ Discover performance opportunities to improve the experience for long-lived pages and SPAs.<br><br> **Limitations** <br> 🤔 Does not provide an overall performance score.<br>🤔 Cannot analyze moment-based performance metrics (e.g. Largest Contentful Paint).<br>🤔 Cannot analyze state-of-the-page issues (e.g. no Accessibility category) |
| Snapshot <br> <img src="https://user-images.githubusercontent.com/39191/170560049-a6b630a2-187a-4233-9f8b-8d7fb276f51e.png" height="96" width="141"> | **Use Cases** <br> ✅ Analyze the page in its current state.<br> ✅ Find accessibility issues deep within SPAs or complex forms.<br>✅ Evaluate best practices of menus and UI elements hidden behind interaction.<br><br> **Limitations** <br> 🤔 Does not provide an overall performance score or metrics.<br>🤔 Cannot analyze any issues outside the current DOM (e.g. no network, main-thread, or performance analysis). |
### Navigation mode
<img src="https://user-images.githubusercontent.com/39191/170560057-4f7cab97-ee6b-497f-8e18-1f84ba3616dd.png">
In DevTools, navigation is easy: ensure it's the selected mode and then click _Analyze page load_.

> Note: DevTools only generates a report for a standalone navigation. To combine it with other steps for a multi-step user flow report, [use the Node API](#creating-a-flow).
#### Navigations in the Node.js API
```js
import {writeFileSync} from 'fs';
import puppeteer from 'puppeteer';
import {startFlow} from 'lighthouse';
const browser = await puppeteer.launch();
const page = await browser.newPage();
const flow = await startFlow(page);
// Navigate with a URL
await flow.navigate('https://example.com');
// Interaction-initiated navigation via a callback function
await flow.navigate(async () => {
await page.click('a.link');
});
// Navigate with startNavigation/endNavigation
await flow.startNavigation();
await page.click('a.link');
await flow.endNavigation();
await browser.close();
writeFileSync('report.html', await flow.generateReport());
```
</details>
<br>
##### Triggering a navigation via user interactions
Instead of providing a URL to navigate to, you can provide a callback function or use `startNavigation`/`endNavigation`, as seen above. This is useful when you want to audit a navigation that's initiated by a scenario like a button click or form submission.
> Aside: Lighthouse typically clears out any active Service Worker and Cache Storage for the origin under test. However, in this case, as it doesn't know the URL being analyzed, Lighthouse cannot clear this storage. This generally reflects the real user experience, but if you still wish to clear the Service Workers and Cache Storage you must do it manually.
This callback function _must_ perform an action that will trigger a navigation. Any interactions completed before the callback promise resolves will be captured by the navigation.
The `startNavigation`/`endNavigation` functions _must_ surround an action that triggers a navigation. Any interactions completed after `startNavigation` is invoked and before `endNavigation` is invoked will be captured by the navigation.
### Timespan
<img src="https://user-images.githubusercontent.com/39191/170560055-fb599418-c94d-44bf-9921-be4dce6abccf.png">
In DevTools, select "Timespan" as the mode and click _Start timespan_. Record whatever timerange or interactions is desired and then click _End timespan_.

#### Timespans in the Node.js API
```js
import {writeFileSync} from 'fs';
import puppeteer from 'puppeteer';
import {startFlow} from 'lighthouse';
const browser = await puppeteer.launch();
const page = await browser.newPage();
await page.goto('https://secret.login');
const flow = await startFlow(page);
await flow.startTimespan();
await page.type('#password', 'L1ghth0useR0cks!');
await page.click('#login');
await page.waitForSelector('#dashboard');
await flow.endTimespan();
await browser.close();
writeFileSync('report.html', await flow.generateReport());
```
</details>
<br>
### Snapshot
<img src="https://user-images.githubusercontent.com/39191/170560049-a6b630a2-187a-4233-9f8b-8d7fb276f51e.png">
In DevTools, select "Snapshot" as the mode. Set up the page in the state you want to evaluate. Then, click _Analyze page state_.

#### Snapshots in the Node.js API
```js
import {writeFileSync} from 'fs';
import puppeteer from 'puppeteer';
import {startFlow} from 'lighthouse';
const browser = await puppeteer.launch();
const page = await browser.newPage();
await page.goto('https://example.com');
const flow = await startFlow(page);
await page.click('#expand-sidebar');
await flow.snapshot();
await browser.close();
writeFileSync('report.html', await flow.generateReport());
```
</details>
<br>
## Creating a Flow
<img src="https://user-images.githubusercontent.com/39191/170560932-f10c8465-de49-4e75-be6c-1cf408cf84f6.png" height=240>
So far we've seen individual Lighthouse modes in action. The true power of flows comes from combining these building blocks into a comprehensive flow to capture the user's entire experience. Analyzing a multi-step user flow is currently only available [using the Lighthouse Node API along with Puppeteer](https://web.dev/articles/lighthouse-user-flows).
When mapping a user flow onto the Lighthouse modes, strive for each report to have a narrow focus. This will make debugging much easier when you have issues to fix!
--------
The below example codifies a user flow for an ecommerce site where the user navigates to the homepage, searches for a product, and clicks on the detail link.
<img alt="Lighthouse User Flows Diagram" src="https://user-images.githubusercontent.com/39191/168932574-944757d8-d110-4777-a01f-0ec27d65719a.png" height="550">
### Complete user Flow Code
```js
import puppeteer from 'puppeteer';
import {startFlow} from 'lighthouse';
import {writeFileSync} from 'fs';
// Setup the browser and Lighthouse.
const browser = await puppeteer.launch();
const page = await browser.newPage();
const flow = await startFlow(page);
// Phase 1 - Navigate to the landing page.
await flow.navigate('https://web.dev/');
// Phase 2 - Interact with the page and submit the search form.
await flow.startTimespan();
await page.click('button[search-open]');
const searchBox = await page.waitForSelector('devsite-search[search-active] input');
await searchBox.type('CLS');
await searchBox.press('Enter');
// Ensure search results have rendered before moving on.
const link = await page.waitForSelector('devsite-content a[href="https://web.dev/articles/cls"]');
await flow.endTimespan();
// Phase 3 - Analyze the new state.
await flow.snapshot();
// Phase 4 - Navigate to the article.
await flow.navigate(async () => {
await link.click();
});
// Get the comprehensive flow report.
writeFileSync('report.html', await flow.generateReport());
// Save results as JSON.
writeFileSync('flow-result.json', JSON.stringify(await flow.createFlowResult(), null, 2));
// Cleanup.
await browser.close();
```
As this flow has multiple steps, the flow report summarizes everything and allows you to investigate each aspect in more detail.

### Creating a desktop user flow
If you want to test the desktop version of a page with user flows, you can use the desktop config provided in the Lighthouse package, which includes desktop scoring and viewport/performance emulation.
```js
import puppeteer from 'puppeteer';
import {startFlow, desktopConfig} from 'lighthouse';
const browser = await puppeteer.launch();
const page = await browser.newPage();
const flow = await startFlow(page, {
config: desktopConfig,
});
await flow.navigate('https://example.com');
```
### Using Puppeteer's emulation settings in a user flow
If you want to inherit the viewport settings set up by Puppeteer, you need to disable Lighthouse's viewport emulation in the `flags` option.
If Puppeteer is emulating a desktop page make sure to use the `desktopConfig` so Lighthouse still scores the results as a desktop page.
```js
import puppeteer from 'puppeteer';
import {startFlow, desktopConfig} from 'lighthouse';
const browser = await puppeteer.launch();
const page = await browser.newPage();
const flow = await startFlow(page, {
// Puppeteer is emulating a desktop environment,
// so we should still use the desktop config.
//
// If Puppeteer is emulating a mobile device then we can remove the next line.
config: desktopConfig,
// `flags` will override the Lighthouse emulation settings
// to prevent Lighthouse from changing the screen dimensions.
flags: {screenEmulation: {disabled: true}},
});
await page.setViewport({width: 1000, height: 500});
await flow.navigate('https://example.com');
```
## Tips and Tricks
- Keep timespan recordings _short_ and focused on a single interaction sequence or page transition.
- Always audit page navigations with navigation mode, avoid auditing hard page navigations with timespan mode.
- Use snapshot recordings when a substantial portion of the page content has changed.
- Always wait for transitions and interactions to finish before ending a timespan. The puppeteer APIs `page.waitForSelector`/`page.waitForFunction`/`page.waitForResponse`/`page.waitForTimeout` are your friends here.
## Related Reading
- [User Flows Issue](https://github.com/GoogleChrome/lighthouse/issues/11313)
- [User Flows Design Document](https://docs.google.com/document/d/1fRCh_NVK82YmIi1Zq8y73_p79d-FdnKsvaxMy0xIpNw/edit#heading=h.b84um9ao7pg7)
- [User Flows Timeline Diagram](https://docs.google.com/drawings/d/1jr9smqqSPsLkzZDEyFj6bvLFqi2OUp7_NxqBnqkT4Es/edit?usp=sharing)
- [User Flows Decision Tree Diagram](https://whimsical.com/lighthouse-flows-decision-tree-9qPyfx4syirwRFH7zdUw8c)
---
# Source: https://github.com/GoogleChrome/lighthouse/blob/main/docs/v8-perf-faq.md
# v8.0 Performance FAQ
### Give me a summary of the perf score changes in v8.0. What's new/different?
First, it may be useful to refresh on [the math behind Lighthouse's metric
scores and performance score.](https://developer.chrome.com/docs/lighthouse/performance/performance-scoring/)
In [Lighthouse v8.0](https://github.com/GoogleChrome/lighthouse/releases/tag/v8.0.0), we updated the score curves for FCP and TBT measurements,
making both a bit more strict. CLS has been updated to its new, [windowed
definition](https://web.dev/articles/evolving-cls). Additionally, the Performance
Score's weighted average was
[rebalanced](https://googlechrome.github.io/lighthouse/scorecalc/#FCP=3000&SI=5800&FMP=4000&TTI=7300&FCI=6500&LCP=4000&TBT=600&CLS=0.25&device=mobile&version=8&version=6&version=5),
giving more weight to CLS and TBT than before, and slightly decreasing the
weights of FCP, SI, and TTI.
From an analysis of HTTP Archive's latest [crawl of the
web](https://httparchive.org/faq#how-does-the-http-archive-decide-which-urls-to-test),
we project that the performance score for the majority of sites will stay the
same or improve in Lighthouse 8.0.
- ~20% of sites may see a drop of up to 5 points, though likely less
- ~20% of sites will see little detectable change
- ~30% of sites should see a moderate improvement of a few points
- ~30% could see a significant improvement of 5 points or more
The biggest drops in scores are due to TBT scoring becoming stricter and the
metric's slightly higher weight. The biggest improvements in scores are also due
to TBT changes in the long tail and the windowing of CLS, and both metrics'
higher weights.
### What are the exact score weighting changes?
#### Changes by metric
| metric | v6 weight | v8 weight | Δ |
|--------------------------------|-----------|-----------|----------|
| First Contentful Paint (FCP) | 15 | **10** | -5 |
| Speed Index (SI) | 15 | **10** | -5 |
| Largest Contentful Paint (LCP) | 25 | **25** | 0 |
| Time To Interactive (TTI) | 15 | **10** | -5 |
| Total Blocking Time (TBT) | 25 | **30** | 5 |
| Cumulative Layout Shift (CLS) | 5 | **15** | 10 |
#### Changes by phase
| phase | metric | v6 phase weight | v8 phase weight | Δ |
|----------------|--------------------------------|-----------------|-----------------|-----|
| early | First Contentful Paint (FCP) | 15 | 10 | -5 |
| mid | Speed Index (SI) | 40 | 35 | -5 |
| | Largest Contentful Paint (LCP) | | | |
| interactivity | Time To Interactive (TTI) | 40 | 40 | 0 |
| | Total Blocking Time (TBT) | | | |
| predictability | Cumulative Layout Shift (CLS) | 5 | 15 | 10 |
### Why did the weight of CLS go up?
When introduced in Lighthouse v6, it was still early days for the metric.
There've been [many improvements and
bugfixes](https://chromium.googlesource.com/chromium/src/+/refs/heads/main/docs/speed/metrics_changelog/cls.md)
to the CLS metric since then. Now, given its maturity and established placement in Core
Web Vitals, the weight increases from 5% to 15%.
### Why are the Core Web Vitals metrics weighted differently in the performance score?
The Core Web Vitals metrics are [independent signals in the Page Experience
ranking
update](https://support.google.com/webmasters/thread/104436075/core-web-vitals-page-experience-faqs-updated-march-2021).
Lighthouse weighs each lab equivalent metric based on what we believe creates
the best incentives to improve overall page experience for users.
LCP, CLS, and TBT are [very good
metrics](https://chromium.googlesource.com/chromium/src/+/lkgr/docs/speed/good_toplevel_metrics.md)
and that's why they are the three highest-weighted metrics in the performance
score.
### How should I think about the Lighthouse performance score in relation to Core Web Vitals?
[Core Web Vitals](https://web.dev/articles/vitals) refer to a specific set of key user
experience metrics, their passing thresholds, and percentile at which they're measured.
In general, CWV's primary focus is field data.
The Lighthouse score is a means to understand the degree of opportunity
available to improve critical elements of user experience. The lower the score,
the more likely the user will struggle with load performance, responsiveness, or
content stability.
Lighthouse's lab-based data overlaps with Core Web Vitals in a few key ways.
Lighthouse features two of the three core vitals (LCP and CLS) with the exact
same passing thresholds. There's no user input in a Lighthouse run, so it cannot
compute FID. Instead, we have TBT, which you can consider a proxy metric for
FID, and though they measure two different things they are both signals about a
page's interactivity.
_So CWV and Lighthouse have commonalities, but are different. How can you
rationalize paying attention to both?_
Ultimately, a combination approach is most effective. Use field data for the
long-term overview of your user's experience, and use lab data to iterate your
way to the best experience possible for your users. CrUX data summarizes [the
most recent 28
days](https://developers.google.com/web/tools/chrome-user-experience-report/api/reference#data-pipeline),
so it'll take some time to confidently determine that any change has definite
impact.
Lighthouse's analysis allows you to debug and optimize in an environment that is
repeatable with an immediate feedback loop. In addition, lab-based tooling can
provide significantly more detail than field instrumentation, as it's not
limited to web-exposed APIs and cross-origin restrictions.
The exact numbers of your lab and field metrics aren't expected to match, but
any substantial improvement to your lab metrics should be observable in the
field once it's been deployed. The higher the Lighthouse score, the less you're
leaving up to chance in the field.
### What blindspots from the field can lab tooling illuminate?
Field data analyzes all successful page loads. But if failed and aborted loads
are excluded, or reporting is blocked by extensions, the collected field data
can suffer from survivorship bias. Users who have better experiences use your
site more; that's why we care about performance in the first place! Lab tooling
shows you the quality of the experience for these users that field data might be
[missing entirely](https://blog.chriszacharias.com/page-weight-matters).
Lighthouse mobile reports emulate a slow 4G connection on a mid-tier Android
device. While field data might not indicate these conditions are especially
common for your site, analyzing how your site performs in these tougher
conditions helps expand your site's audience. Lighthouse identifies the worst
experiences, experiences you can't see in the field because they were so bad the
user never came back (or waited around in the first place).
As always, using both lab and field data to understand and optimize your user
experience is best practice. [Read more about field & lab](https://developers.google.com/web/fundamentals/performance/speed-tools).
### How should I work to optimize CLS differently given that it has been updated?
The [windowing adjustment](https://web.dev/articles/evolving-cls)
will likely not have much effect for the lab measurement, but instead will have
a large effect on the field CLS for long-lived pages.
Lighthouse 8 introduces another adjustment to our CLS definition: including
layout shift contributions from subframes. This brings our implementation in
line with how CrUX computes field CLS. This comes with the implication that
iframes (including ones you may not control) may be adding layout shifts which
ultimately affect your CLS score. Keep in mind that the subframe contributions
are [weighted by the in-viewport
portion](https://github.com/WICG/layout-instability#cumulative-scores) of the
iframe.
### Why don't the numbers for TBT and FID match, if TBT is a proxy metric for FID?
The commonality between TBT (collected in a lab environment) and FID (collected
in a field context) is that they measure the impact on input responsiveness from
long tasks on the main thread. Beyond that, they're quite different. FID
captures the delay in handling the first input event of the page, whenever that
input happened. TBT roughly captures how dangerous the length of all the main
thread's tasks are.
It's very possible to have a page that does well on FID, but poorly on TBT. And
it's slightly harder, but possible, to do well on TBT but poorly on FID\*. So,
you shouldn't expect your TBT and FID measurements to correlate strongly. A
large-scale analysis found their [Spearman's
ρ](https://en.wikipedia.org/wiki/Spearman%27s_rank_correlation_coefficient) at
about 0.40, which indicates a connection, but not one as strong as many would
prefer.
From the Lighthouse project's perspective, the current passing threshold for FID
is quite lenient but more importantly, the percentile-of-record for FID (75th
percentile) is not sufficient for detecting issues. The 95th percentile is a
much stronger indicator of problematic interactions for this metric. We
encourage user-centric teams to focus on the 95th percentile of all input delays
(not just the first) in their field data in order to identify and address
problems that surface just 5% of the time.
\*Aside: the [Chrome 91 FID change for
double-tap-to-zoom](https://chromium.googlesource.com/chromium/src.git/+/refs/heads/main/docs/speed/metrics_changelog/2021_05_fid.md)
fixes a lot of high FID / low TBT cases and may be observable in your field
metrics, with higher percentiles improving slightly. Most remaining high FID /
low TBT cases are likely due to incorrect meta viewport tags, which [Lighthouse
will flag](https://developer.chrome.com/docs/lighthouse/pwa/viewport/).
Delivering a mobile-friendly viewport, reducing main-thread blocking JS, and
keeping your TBT low is the best defense against bad FID in the field.
### Overall, what motivated the changes to the performance score?
As with all Lighthouse score updates, changes are made to reflect
the latest in how to measure user-experience quality holistically and accurately,
and to focus attention on key priorities.
Heavy JS and long tasks are a problem for the web that's
[worsening](https://httparchive.org/reports/state-of-javascript#bytesJs). Field
FID is currently too lenient and not sufficiently incentivizing action to
address the problem. Lighthouse has historically weighed its interactivity
metrics at 40-55% of the performance score and—as interactivity is key to user
experience—we maintain a 40% weighting (TBT and TTI together) in Lighthouse
8.0.
[FCP's score curve was
adjusted](https://github.com/GoogleChrome/lighthouse/pull/12556) to align with
the current de facto ["good" threshold](https://web.dev/articles/fcp#what_is_a_good_fcp_score),
and as a result will score a bit more strictly.
The curve for TBT was made stricter to [more closely
approach](https://github.com/GoogleChrome/lighthouse/pull/12576) the ideal score
curve. TBT has had (and still has) a more lenient curve than our methodology
dictates, but the new curve is more linear which means there's a larger range
where improvements in the metric are rewarded with improvements in the score. If
your page currently scores poorly with TBT, the new curve will be more
responsive to changes as page performance incrementally improves.
FCP's weight drops slightly from 15% to 10% because it's fairly gameable and is also partly
captured by Speed Index.
### What's the story with TTI?
TTI serves a useful role as it's the largest metric value reported (often >10
seconds) and helps anchor perceptions.
We see TBT as a stronger metric for evaluating the health of your main thread
and its impact on interactivity, plus it [has lower
variability](https://docs.google.com/document/d/1xCERB_X7PiP5RAZDwyIkODnIXoBk-Oo7Mi9266aEdGg/edit).
TTI serves as a nice complement that captures the cost of long tasks, often
from heavy JavaScript. That said, we expect to continue to reduce the weight
of TTI and will likely remove it in a future major Lighthouse release.
### How does the Lighthouse Perf score get calculated? What is it based on?
The Lighthouse perf score is calculated from a weighted, blended set of
performance metrics. You can see the current and previous Lighthouse score
compositions (which metrics we are blending together, and at what weights) in
the [score
calculator](https://googlechrome.github.io/lighthouse/scorecalc/#FCP=3000&SI=5800&FMP=4000&TTI=7300&FCI=6500&LCP=4000&TBT=600&CLS=0.25&device=mobile&version=8&version=6&version=5),
and learn more about the [calculation specifics
here](https://developer.chrome.com/docs/lighthouse/performance/performance-scoring/).
### What is the most exciting update in LH v8?
We're really excited about the [interactive
treemap](https://github.com/GoogleChrome/lighthouse/releases/tag/v7.5.0#:~:text=We%20are%20releasing%20the%20Lighthouse%20Treemap),
[filtering audits by
metric](https://github.com/GoogleChrome/lighthouse/releases/tag/v8.0.0#:~:text=The%20report%20includes%20a-,new%20metric%20filter,-.%20Pick%20a%20metric),
and the new [Content Security Policy
audit](https://web.dev/articles/strict-csp#adopting_a_strict_csp), which was a
collaboration with the Google Web Security team.
---
# Source: https://github.com/GoogleChrome/lighthouse/blob/main/docs/variability.md
# Score Variability
## Summary
Lighthouse performance scores will change due to inherent variability in web and network technologies, even if there hasn't been a code change. Run Lighthouse multiple times and beware of variability before drawing conclusions about a performance-impacting change.
## Sources of Variability
Variability in performance measurement is introduced via a number of channels with different levels of impact. Below is a table containing several common sources of metric variability, the typical impact they have on results, and the extent to which they are likely to occur in different environments.
| Source | Impact | Typical End User | PageSpeed Insights | Controlled Lab |
| --------------------------- | ------ | ---------------- | ------------------ | -------------- |
| Page nondeterminism | High | LIKELY | LIKELY | LIKELY |
| Local network variability | High | LIKELY | UNLIKELY | UNLIKELY |
| Tier-1 network variability | Medium | POSSIBLE | POSSIBLE | POSSIBLE |
| Web server variability | Low | LIKELY | LIKELY | LIKELY |
| Client hardware variability | High | LIKELY | UNLIKELY | UNLIKELY |
| Client resource contention | High | LIKELY | POSSIBLE | UNLIKELY |
| Browser nondeterminism | Medium | CERTAIN | CERTAIN | CERTAIN |
Below are more detailed descriptions of the sources of variance and the impact they have on the most likely combinations of Lighthouse runtime + environment. While DevTools throttling and simulated throttling approaches could be used in any of these three environments, the typical end user uses simulated throttling.
### Page Nondeterminism
Pages can contain logic that is nondeterministic that changes the way a user experiences a page, i.e. an A/B test that changes the layout and assets loaded or a different ad experience based on campaign progress. This is an intentional and irremovable source of variance. If the page changes in a way that hurts performance, Lighthouse should be able to identify this case. The only mitigation here is on the part of the site owner in ensuring that the exact same version of the page is being tested between different runs.
### Local Network Variability
Local networks have inherent variability from packet loss, variable traffic prioritization, and last-mile network congestion. Users with cheap routers and many devices sharing limited bandwidth are usually the most susceptible to this. _DevTools_ throttling partially mitigates these effects by applying a minimum request latency and maximum throughput that masks underlying retries. _Simulated_ throttling mitigates these effects by replaying network activity on its own.
### Tier-1 Network Variability
Network interconnects are generally very stable and have minimal impact but cross-geo requests, i.e. measuring performance of a Chinese site from the US, can start to experience a high degree of latency introduced from tier-1 network hops. _DevTools_ throttling partially masks these effects with network throttling. _Simulated_ throttling mitigates these effects by replaying network activity on its own.
### Web Server Variability
Web servers have variable load and do not always respond with the same delay. Lower-traffic sites with shared hosting infrastructure are typically more susceptible to this. _DevTools_ throttling partially masks these effects by applying a minimum request latency in its network throttling. _Simulated_ throttling is susceptible to this effect but the overall impact is usually low when compared to other network variability.
### Client Hardware Variability
The hardware on which the webpage is loading can greatly impact performance. _DevTools_ throttling cannot do much to mitigate this issue. _Simulated_ throttling partially mitigates this issue by capping the theoretical execution time of CPU tasks during simulation.
### Client Resource Contention
Other applications running on the same machine while Lighthouse is running can cause contention for CPU, memory, and network resources. Malware, browser extensions, and anti-virus software have particularly strong impacts on web performance. Multi-tenant server environments (such as Travis, AWS, etc) can also suffer from these issues. Running multiple instances of Lighthouse at once also typically distorts results due to this problem. _DevTools_ throttling is susceptible to this issue. _Simulated_ throttling partially mitigates this issue by replaying network activity on its own and capping CPU execution.
### Browser Nondeterminism
Browsers have inherent variability in their execution of tasks that impacts the way webpages are loaded. This is unavoidable for devtools throttling as at the end of the day they are simply reporting whatever was observed by the browser. _Simulated_ throttling is able to partially mitigate this effect by simulating execution on its own, only re-using task execution times from the browser in its estimate.
### Effect of Throttling Strategies
Below is a table containing several common sources of metric variability, the typical impact they have on results, and the extent to which different Lighthouse throttling strategies are able to mitigate their effect. Learn more about different throttling strategies in our [throttling documentation](./throttling.md).
| Source | Impact | Simulated Throttling | DevTools Throttling | No Throttling |
| --------------------------- | ------ | -------------------- | ------------------- | ------------- |
| Page nondeterminism | High | NO MITIGATION | NO MITIGATION | NO MITIGATION |
| Local network variability | High | MITIGATED | PARTIALLY MITIGATED | NO MITIGATION |
| Tier-1 network variability | Medium | MITIGATED | PARTIALLY MITIGATED | NO MITIGATION |
| Web server variability | Low | NO MITIGATION | PARTIALLY MITIGATED | NO MITIGATION |
| Client hardware variability | High | PARTIALLY MITIGATED | NO MITIGATION | NO MITIGATION |
| Client resource contention | High | PARTIALLY MITIGATED | NO MITIGATION | NO MITIGATION |
| Browser nondeterminism | Medium | PARTIALLY MITIGATED | NO MITIGATION | NO MITIGATION |
## Strategies for Dealing With Variance
### Run on Adequate Hardware
Loading modern webpages on a modern browser is not an easy task. Using appropriately powerful hardware can make a world of difference when it comes to variability.
- Minimum 2 dedicated cores (4 recommended)
- Minimum 2GB RAM (4-8GB recommended)
- Avoid non-standard Chromium flags (`--single-process` is not supported, `--no-sandbox` and `--headless` should be OK, though educate yourself about [sandbox tradeoffs](https://github.com/GoogleChrome/lighthouse-ci/tree/fbb540507c031100ee13bf7eb1a4b61c79c5e1e6/docs/recipes/docker-client#--no-sandbox-issues-explained))
- Avoid function-as-a-service infrastructure (Lambda, GCF, etc)
- Avoid "burstable" or "shared-core" instance types (AWS `t` instances, GCP shared-core N1 and E2 instances, etc)
AWS's `m5.large`, GCP's `n2-standard-2`, and Azure's `D2` all should be sufficient to run a single Lighthouse run at a time (~$0.10/hour for these instance types, ~30s/test, ~$0.0008/Lighthouse report). While some environments that don't meet the requirements above will still be able to run Lighthouse and the non-performance results will still be usable, we'd advise against it and won't be able to support those environments should any bugs arise. Remember, running on inconsistent hardware will lead to inconsistent results!
**DO NOT** collect multiple Lighthouse reports at the same time on the same machine. Concurrent runs can skew performance results due to resource contention. When it comes to Lighthouse runs, scaling horizontally is better than scaling vertically (i.e. run with 4 `n2-standard-2` instead of 1 `n2-standard-8`).
### Isolate External Factors
- Isolate your page from third-party influence as much as possible. It’s never fun to be blamed for someone else's variable failures.
- Isolate your own code’s nondeterminism during testing. If you’ve got an animation that randomly shows up, your performance numbers might be random too!
- Isolate your test server from as much network volatility as possible. Use localhost or a machine on the same exact network whenever stability is a concern.
- Isolate your client environment from external influences like anti-virus software and browser extensions. Use a dedicated device for testing when possible.
If your machine has really limited resources or creating a clean environment has been difficult, use a hosted lab environment like PageSpeed Insights or WebPageTest to run your tests for you. In continuous integration situations, use dedicated servers when possible. Free CI environments and “burstable” instances are typically quite volatile.
### Run Lighthouse Multiple Times
When creating your thresholds for failure, either mental or programmatic, use aggregate values like the median, 90th percentile, or even min/max instead of single test results.
The median Lighthouse score of 5 runs is twice as stable as 1 run. There are multiple ways to get a Lighthouse report, but the simplest way to run Lighthouse multiple times and also get a median run is to use [lighthouse-ci](https://github.com/GoogleChrome/lighthouse-ci/).
```bash
npx -p @lhci/cli lhci collect --url https://example.com -n 5
npx -p @lhci/cli lhci upload --target filesystem --outputDir ./path/to/dump/reports
```
> Note: you must have [Node](https://nodejs.org/en/download/package-manager/) installed.
You can then process the reports that are output to the filesystem. Read the [Lighthouse CI documentation](https://github.com/GoogleChrome/lighthouse-ci/blob/main/docs/configuration.md#outputdir) for more.
```js
const fs = require('fs');
const lhciManifest = require('./path/to/dump/reports/manifest.json');
const medianEntry = lhciManifest.find(entry => entry.isRepresentativeRun)
const medianResult = JSON.parse(fs.readFileSync(medianEntry.jsonPath, 'utf-8'));
console.log('Median performance score was', medianResult.categories.performance.score * 100);
```
You can also direct `lighthouse-ci` to use PageSpeedInsights:
```bash
npx -p @lhci/cli lhci collect --url https://example.com -n 5 --mode psi --psiApiKey xXxXxXx
npx -p @lhci/cli lhci upload --target filesystem --outputDir ./path/to/dump/reports
```
If you're running Lighthouse directly via node, you can use the `computeMedianRun` function to determine the median using a blend of the performance metrics.
```js
const spawnSync = require('child_process').spawnSync;
const lighthouseCli = require.resolve('lighthouse/cli');
const {computeMedianRun} = require('lighthouse/core/lib/median-run.js');
const results = [];
for (let i = 0; i < 5; i++) {
console.log(`Running Lighthouse attempt #${i + 1}...`);
const {status = -1, stdout} = spawnSync('node', [
lighthouseCli,
'https://example.com',
'--output=json'
]);
if (status !== 0) {
console.log('Lighthouse failed, skipping run...');
continue;
}
results.push(JSON.parse(stdout));
}
const median = computeMedianRun(results);
console.log('Median performance score was', median.categories.performance.score * 100);
```
## Related Documentation
- [Lighthouse Variability and Accuracy Analysis](https://docs.google.com/document/d/1BqtL-nG53rxWOI5RO0pItSRPowZVnYJ_gBEQCJ5EeUE/edit?usp=sharing)
- [Throttling documentation](./throttling.md)
- [Why is my Lighthouse score different from PageSpeed Insights?](https://www.debugbear.com/blog/why-is-my-lighthouse-score-different-from-pagespeed-insights)
### Plugin Audits
A plugin audit is a class that implements at least two properties: `meta` and `audit()`.
#### `meta`
The `meta` property is a static getter for the metadata of an [audit](#custom-audits). It should return an object with the following properties:
- `id: string` **REQUIRED** - The string identifier of the audit, in kebab case, typically matching the file name.
- `title: string` **REQUIRED** - Short, user-visible title for the audit when successful.
- `failureTitle: string` _OPTIONAL_ - Short, user-visible title for the audit when failing.
- `description: string` **REQUIRED** - A more detailed description that describes why the audit is important and links to Lighthouse documentation on the audit; markdown links supported.
- `requiredArtifacts: Array` **REQUIRED** - A list of artifacts that must be present for the audit to execute. See [Available Artifacts](#available-artifacts) for what's available to plugins.
- `scoreDisplayMode: "numeric" | "binary" | "manual" | "informative"` _OPTIONAL_ - A string identifying how the score should be interpreted for display.
See [Best Practices > Naming](#naming) for best practices on the display strings.
#### `audit(artifacts, context)`
The `audit()` property is a function the computes the audit results for the report. It accepts two arguments: `artifacts` and `context`. `artifacts` is an object whose keys will be the values you passed to `requiredArtifacts` in the `meta` object. `context` is an internal object whose primary use in plugins is to derive network request information (see [Using Network Requests](#using-network-requests)).
The primary objective of the audit function is to return a `score` from `0` to `1` based on the data observed in `artifacts`. There are several other properties that can be returned by an audit to control additional display features. For the complete list, see the [audit results documentation](./understanding-results.md#audit-properties) and [type information](https://github.com/GoogleChrome/lighthouse/blob/623b789497f6c87f85d366b4038deae5dc701c90/types/audit.d.ts#L69-L87).
#### Available Artifacts
The following artifacts are available for use in the audits of Lighthouse plugins. For more detailed information on their usage and purpose, see the [type information](https://github.com/GoogleChrome/lighthouse/blob/main/types/artifacts.d.ts#L42-L99).
- `fetchTime`
- `BenchmarkIndex`
- `settings`
- `Timing`
- `HostFormFactor`
- `HostUserAgent`
- `HostProduct`
- `GatherContext`
- `URL`
- `ConsoleMessages`
- `DevtoolsLog`
- `MainDocumentContent`
- `ImageElements`
- `LinkElements`
- `MetaElements`
- `Scripts`
- `Trace`
- `ViewportDimensions`
While Lighthouse has more artifacts with information about the page than are in this list, those artifacts are considered experimental and their structure or existence could change at any time. Only use artifacts not on the list above if you are comfortable living on the bleeding edge and can tolerate unannounced breaking changes.
If you're interested in other page information not mentioned here, please file an issue. We'd love to help.
#### Using Network Requests
You might have noticed that a simple array of network requests is missing from the list above. The source information for network requests made by the page is actually contained in the `DevtoolsLog` artifact, which contains all the of DevTools Protocol traffic recorded during page load. The network request objects are derived from this message log at audit time.
See below for an example of an audit that processes network requests.
```js
import {Audit, NetworkRecords} from 'lighthouse';
class HeaderPoliceAudit {
static get meta() {
return {
id: 'header-police-audit-id',
title: 'All headers stripped of debug data',
failureTitle: 'Headers contained debug data',
description: 'Pages should mask debug data in production.',
requiredArtifacts: ['DevtoolsLog'],
};
}
static async audit(artifacts, context) {
// Request the network records from the devtools log.
// The `context` argument is passed in to allow Lighthouse to cache the result and not re-compute the network requests for every audit that needs them.
const devtoolsLog = artifacts.DevtoolsLog;
const requests = await NetworkRecords.request(devtoolsLog, context);
// Do whatever you need to with the network requests.
const badRequests = requests.filter(request =>
request.responseHeaders.some(header => header.name.toLowerCase() === 'x-debug-data')
);
return {
score: badRequests.length === 0 ? 1 : 0,
};
}
}
export default HeaderPoliceAudit;
```
## Best Practices
### Naming
> There are only two hard things in Computer Science: cache invalidation and naming things.
> Phil Karlton
There are several display strings you will need to write in the course of plugin development. To ensure your plugin users have a consistent experience with the rest of the Lighthouse report, follow these guidelines.
#### Category Titles
Write category titles that are short (fewer than 20 characters), ideally a single word or acronym. Avoid unnecessary prefixes like "Lighthouse" or "Plugin" which will already be clear from the context of the report.
#### Category Descriptions
Write category descriptions that provide context for your plugin's audits and link to where users can learn more or ask questions about their advice.
#### Audit Titles
Write audit titles in the _present_ tense that _describe_ what the page is successfully or unsuccessfully doing.
**DO**
> Document has a `` element
> Document does not have a `<title>` element
> Uses HTTPS
> Does not use HTTPS
> Tap targets are sized appropriately
> Tap targets are not sized appropriately
**DON'T**
> Good job on `alt` attributes
> Fix your headers
#### Audit Descriptions
Write audit descriptions that provide brief context for why the audit is important and link to more detailed guides on how to follow its advice. Markdown links are supported, so use them!
**DO**
> Interactive elements like buttons and links should be large enough (48x48px), and have enough space around them, to be easy enough to tap without overlapping onto other elements. [Learn more](https://developers.google.com/web/fundamentals/accessibility/accessible-styles#multi-device_responsive_design).
> All sites should be protected with HTTPS, even ones that don\'t handle sensitive data. HTTPS prevents intruders from tampering with or passively listening in on the communications between your app and your users, and is a prerequisite for HTTP/2 and many new web platform APIs. [Learn more](https://developers.google.com/web/tools/lighthouse/audits/https).
**DON'T**
> Images need alt attributes.
> 4.8.4.4 Requirements for providing text to act as an alternative for images
> Except where otherwise specified, the alt attribute.... 10,000 words later... and that is everything you need to know about the `alt` attribute!
### Scoring
1. Weight each audit by its importance.
1. Differentiate scores within an audit by returning a number _between_ `0` and `1`. Scores greater than `0.9` will be hidden in "Passed Audits" section by default.
1. Avoid inflating scores unnecessarily by marking audits as not applicable. When an audit's advice doesn't apply, simply `return {score: null, notApplicable: true}`.
### Common Mistakes
The web is a diverse place, and your plugin will be run on pages you never thought existed. Here are a few things to keep in mind when writing your audit to avoid common bugs. The Lighthouse team has made all of these mistakes below, so you're in good company!
#### Forgetting to Filter
Most audits will have a specific use case in mind that will apply to most elements or requests, but there are corner cases that come up fairly frequently that are easy to forget.
**Examples:**
- Non-network network requests (`blob:`, `data:`, `file:`, etc)
- Non-javascript scripts (`type="x-shader/x-vertex"`, `type="application/ld+json"`, etc)
- Tracking pixel images (images with size 1x1, 0x0, etc)
#### Forgetting to Normalize
Most artifacts will try to represent as truthfully as possible what was observed from the page. When possible, the values are normalized according to the spec as you would access them from the DOM, but typically no transformation beyond this is done. This means that some values will have leading or trailing whitespace, be mixed-case, potentially missing, relative URLs instead of absolute, etc.
**Examples:**
- Header names and values
- Script `type` values
- Script `src` values
## Examples
- [Cinememe Plugin](https://github.com/exterkamp/lighthouse-plugin-cinememe) - Find and reward dank cinememes (5MB+ animated GIFs ;)
- [YouTube Embed](https://github.com/connorjclark/lighthouse-plugin-yt) - Identifies YouTube embeds
- [Lighthouse Plugin Recipe](./recipes/lighthouse-plugin-example)
- [Field Performance](https://github.com/treosh/lighthouse-plugin-field-performance) - A plugin to gather and display Chrome UX Report field data
- [Publisher Ads Audits](https://github.com/googleads/pub-ads-lighthouse-plugin) - a well-written, but complex, plugin
- [Green Web Foundation](https://github.com/thegreenwebfoundation/lighthouse-plugin-greenhouse) - A plugin to see which domains run on renewable power.
- [requests-content-md5](https://www.npmjs.com/package/lighthouse-plugin-md5) - Generates MD5 hashes from the content of network requests..
---
# Source: https://github.com/GoogleChrome/lighthouse/blob/main/docs/puppeteer.md
# Using Puppeteer with Lighthouse
## Recipes
### [Using Puppeteer for authenticated pages](./recipes/auth/README.md)
### [Using Puppeteer in a custom gatherer](https://github.com/GoogleChrome/lighthouse/tree/main/docs/recipes/custom-gatherer-puppeteer)
## General Process
### Option 1: Launch Chrome with Puppeteer and handoff to Lighthouse
The example below shows how to inject CSS into the page before Lighthouse audits the page.
A similar approach can be taken for injecting JavaScript.
```js
import puppeteer from 'puppeteer';
import lighthouse from 'lighthouse';
const url = 'https://chromestatus.com/features';
// Use Puppeteer to launch headless Chrome
// - Omit `--enable-automation` (See https://github.com/GoogleChrome/lighthouse/issues/12988)
// - Don't use 800x600 default viewport
const browser = await puppeteer.launch({
// Set to false if you want to see the script in action.
headless: 'new',
defaultViewport: null,
ignoreDefaultArgs: ['--enable-automation']
});
const page = await browser.newPage();
// Wait for Lighthouse to open url, then inject our stylesheet.
browser.on('targetchanged', async target => {
if (page && page.url() === url) {
await page.addStyleTag({content: '* {color: red}'});
}
});
// Lighthouse will open the URL.
// Puppeteer will observe `targetchanged` and inject our stylesheet.
const {lhr} = await lighthouse(url, undefined, undefined, page);
console.log(`Lighthouse scores: ${Object.values(lhr.categories).map(c => c.score).join(', ')}`);
await browser.close();
```
### Option 2: Launch Chrome with Lighthouse/chrome-launcher and handoff to Puppeteer
When using Lighthouse programmatically, you'll often use chrome-launcher to launch Chrome.
Puppeteer can reconnect to this existing browser instance like so:
```js
import chromeLauncher from 'chrome-launcher';
import puppeteer from 'puppeteer';
import lighthouse from 'lighthouse';
const url = 'https://chromestatus.com/features';
// Launch chrome using chrome-launcher.
const chrome = await chromeLauncher.launch();
// Connect to it using puppeteer.connect().
const resp = await fetch(`http://localhost:${chrome.port}/json/version`);
const {webSocketDebuggerUrl} = await resp.json();
const browser = await puppeteer.connect({browserWSEndpoint: webSocketDebuggerUrl});
const page = await browser.newPage();
// Run Lighthouse.
const {lhr} = await lighthouse(url, undefined, undefined, page);
console.log(`Lighthouse scores: ${Object.values(lhr.categories).map(c => c.score).join(', ')}`);
await browser.disconnect();
chrome.kill();
```
---
# Source: https://github.com/GoogleChrome/lighthouse/blob/main/docs/readme.md
This directory contains useful documentation, examples (keep reading),
and [recipes](./recipes/) to get you started. For an overview of Lighthouse's
internals, see [Lighthouse Architecture](architecture.md).
## Using programmatically
The example below shows how to run Lighthouse programmatically as a Node module. It
assumes you've installed Lighthouse as a dependency (`yarn add --dev lighthouse`).
```js
import fs from 'fs';
import lighthouse from 'lighthouse';
import * as chromeLauncher from 'chrome-launcher';
const chrome = await chromeLauncher.launch({chromeFlags: ['--headless']});
const options = {logLevel: 'info', output: 'html', onlyCategories: ['performance'], port: chrome.port};
const runnerResult = await lighthouse('https://example.com', options);
// `.report` is the HTML report as a string
const reportHtml = runnerResult.report;
fs.writeFileSync('lhreport.html', reportHtml);
// `.lhr` is the Lighthouse Result as a JS object
console.log('Report is done for', runnerResult.lhr.finalDisplayedUrl);
console.log('Performance score was', runnerResult.lhr.categories.performance.score * 100);
chrome.kill();
```
### Performance-only Lighthouse run
Many modules consuming Lighthouse are only interested in the performance numbers.
You can limit the audits you run to a particular category or set of audits.
```js
const flags = {onlyCategories: ['performance']};
await lighthouse(url, flags);
```
You can also craft your own config (e.g. [experimental-config.js](https://github.com/GoogleChrome/lighthouse/blob/main/core/config/experimental-config.js)) for custom runs. Also see the [basic custom audit recipe](https://github.com/GoogleChrome/lighthouse/tree/main/docs/recipes/custom-audit).
### Differences from CLI flags
Note that some flag functionality is only available to the CLI. The set of shared flags that work in both node and CLI can be found [in our typedefs](https://github.com/GoogleChrome/lighthouse/blob/main/types/lhr/settings.d.ts#:~:text=interface%20SharedFlagsSettings). In most cases, the functionality is not offered in the node module simply because it is easier and more flexible to do it yourself.
| CLI Flag | Differences in Node |
| - | - |
| `port` | Only specifies which port to use, Chrome is not launched for you. |
| `chromeFlags` | Ignored, Chrome is not launched for you. |
| `outputPath` | Ignored, output is returned as string in `.report` property. |
| `saveAssets` | Ignored, artifacts are returned in `.artifacts` property. |
| `view` | Ignored, use the `open` npm module if you want this functionality. |
| `enableErrorReporting` | Ignored, error reporting is always disabled for node. |
| `listAllAudits` | Ignored, not relevant in programmatic use. |
| `listTraceCategories` | Ignored, not relevant in programmatic use. |
| `configPath` | Ignored, pass the config in as the 3rd argument to `lighthouse`. |
| `preset` | Ignored, pass the config in as the 3rd argument to `lighthouse`. |
| `verbose` | Ignored, use `logLevel` instead. |
| `quiet` | Ignored, use `logLevel` instead. |
### Turn on logging
If you want to see log output as Lighthouse runs, set an appropriate logging level in your code and pass
the `logLevel` flag when calling `lighthouse`.
```javascript
const flags = {logLevel: 'info'};
await lighthouse('https://example.com', flags);
```
## Configuration
In order to extend the Lighthouse configuration programmatically, you need to pass the config object as the 3rd argument. If omitted, a default configuration is used.
**Example:**
```js
{
extends: 'lighthouse:default',
settings: {
onlyAudits: [
'speed-index',
'interactive',
],
},
}
```
You can extend base configuration from [lighthouse:default](https://github.com/GoogleChrome/lighthouse/blob/main/core/config/default-config.js), or you can build up your own configuration from scratch to have complete control.
For more information on the types of config you can provide, see [Lighthouse Configuration](https://github.com/GoogleChrome/lighthouse/blob/main/docs/configuration.md).
## Testing on a site with authentication
When installed globally via `npm i -g lighthouse` or `yarn global add lighthouse`,
`chrome-debug` is added to your `PATH`. This binary launches a standalone Chrome
instance with an open debugging port.
1. Run `chrome-debug`. This will log the debugging port of your Chrome instance
1. Navigate to your site and log in.
1. In a separate terminal tab, run `lighthouse http://mysite.com --port port-number` using the port number from chrome-debug.
## Testing on a site with an untrusted certificate
When testing a site with an untrusted certificate, Chrome will be unable to load the page and so the Lighthouse report will mostly contain errors.
If this certificate **is one you control** and is necessary for development (for instance, `localhost` with a self-signed certificate for local HTTP/2 testing), we recommend you _add the certificate to your locally-trusted certificate store_. In Chrome, see `Settings` > `Privacy and Security` > `Manage certificates` or consult instructions for adding to the certificate store in your operating system.
Alternatively, you can instruct Chrome to ignore the invalid certificate by adding the Lighthouse CLI flag `--chrome-flags="--ignore-certificate-errors"`. However, you must be as careful with this flag as it's equivalent to browsing the web with TLS disabled. Any content loaded by the test page (e.g. third-party scripts or iframed ads) will *also* not be subject to certificate checks, [opening up avenues for MitM attacks](https://www.chromium.org/Home/chromium-security/education/tls#TOC-What-security-properties-does-TLS-give-me-). For these reasons, we recommend the earlier solution of adding the certificate to your local cert store.
## Testing on a mobile device
Lighthouse can run against a real mobile device. You can follow the [Remote Debugging on Android (Legacy Workflow)](https://developer.chrome.com/devtools/docs/remote-debugging-legacy) up through step 3.3, but the TL;DR is install & run adb, enable USB debugging, then port forward 9222 from the device to the machine with Lighthouse.
You'll likely want to use the CLI flags `--screenEmulation.disabled --throttling.cpuSlowdownMultiplier=1 --throttling-method=provided` to disable any additional emulation.
```sh
$ adb kill-server
$ adb devices -l
* daemon not running. starting it now on port 5037 *
* daemon started successfully *
00a2fd8b1e631fcb device usb:335682009X product:bullhead model:Nexus_5X device:bullhead
$ adb forward tcp:9222 localabstract:chrome_devtools_remote
$ lighthouse --port=9222 --screenEmulation.disabled --throttling.cpuSlowdownMultiplier=1 --throttling-method=provided https://example.com
```
## Lighthouse as trace processor
Lighthouse can be used to analyze trace and performance data collected from other tools (like WebPageTest and ChromeDriver). The `Trace` and `DevtoolsLog` artifact items can be provided using a string for the absolute path on disk if they're saved with `.trace.json` and `.devtoolslog.json` file extensions, respectively. The `DevtoolsLog` array is captured from the `Network` and `Page` domains (a la ChromeDriver's [enableNetwork and enablePage options](https://sites.google.com/a/chromium.org/chromedriver/capabilities#TOC-perfLoggingPrefs-object)).
As an example, here's a trace-only run that reports on user timings and critical request chains:
### `config.json`
```json
{
"settings": {
"auditMode": "/User/me/lighthouse/core/test/fixtures/artifacts/perflog/",
},
"audits": [
"user-timings",
"critical-request-chains"
],
"categories": {
"performance": {
"name": "Performance Metrics",
"description": "These encapsulate your web app's performance.",
"audits": [
{"id": "user-timings", "weight": 1},
{"id": "critical-request-chains", "weight": 1}
]
}
}
}
```
Then, run with: `lighthouse --config-path=config.json http://www.random.url`
---
# Source: https://github.com/GoogleChrome/lighthouse/blob/main/docs/recipes/custom-audit/readme.md
# Basic Custom Audit Recipe
> **Tip**: see [Lighthouse Architecture](../../../docs/architecture.md) for information
on terminology and architecture.
## What this example does
This example shows how to write a custom Lighthouse audit for a hypothetical search page. The page is considered fully initialized when the main search box (the page's "hero element") is ready to be used. When this happens, the page uses `performance.now()` to mark the time it took to become ready and saves the value in a global variable called `window.myLoadMetrics.searchableTime`.
## The Audit, Gatherer, and Config
- [searchable-gatherer.js](searchable-gatherer.js) - a [Gatherer](https://github.com/GoogleChrome/lighthouse/blob/main/docs/architecture.md#components--terminology) that collects `window.myLoadMetrics.searchableTime`
from the context of the page.
- [searchable-audit.js](searchable-audit.js) - an [Audit](https://github.com/GoogleChrome/lighthouse/blob/main/docs/architecture.md#components--terminology) that tests whether or not `window.myLoadMetrics.searchableTime`
stays below a 4000ms threshold. In other words, Lighthouse will consider the audit "passing"
in the report if the search box initializes within 4s.
- [custom-config.js](custom-config.js) - this file tells Lighthouse where to
find the gatherer and audit files, when to run them, and how to incorporate their
output into the Lighthouse report. This example extends [Lighthouse's
default configuration](https://github.com/GoogleChrome/lighthouse/blob/main/core/config/default-config.js).
**Note**: when extending the default configuration file, all arrays will be concatenated and primitive values will override the defaults.
## Run the configuration
Run Lighthouse with the custom audit by using the `--config-path` flag with your configuration file:
```sh
lighthouse --config-path=custom-config.js https://example.com
```
---
# Source: https://github.com/GoogleChrome/lighthouse/blob/main/docs/recipes/custom-gatherer-puppeteer/readme.md
# Using Puppeteer in a Gatherer
> **Tip**: see [Basic Custom Audit Recipe](../custom-audit) for basic information about custom audits.
```sh
lighthouse --config-path=custom-config.js https://www.example.com
```
---
# Source: https://github.com/GoogleChrome/lighthouse/blob/main/docs/recipes/lighthouse-plugin-example/readme.md
# Lighthouse plugin recipe
The result of this guide can be found at our [Lighthouse Plugin GitHub repository template](https://github.com/GoogleChrome/lighthouse-plugin-example)
## Contents
- `package.json` - declares the plugin's entry point (`plugin.js`)
- `plugin.js` - instructs Lighthouse to run the plugin's own `preload-as.js` audit; describes the new category and its details for the report
- `audits/preload-as.js` - the new audit to run in addition to Lighthouse's default audits
## To develop as a plugin developer
Run the following to start of with the recipe as a template:
```sh
mkdir lighthouse-plugin-example && cd lighthouse-plugin-example
curl -L https://github.com/GoogleChrome/lighthouse/archive/main.zip | tar -xzv
mv lighthouse-main/docs/recipes/lighthouse-plugin-example/* ./
rm -rf lighthouse-main
```
Install and run just your plugin:
```sh
yarn
NODE_PATH=.. npx lighthouse -- https://example.com --plugins=lighthouse-plugin-example --only-categories=lighthouse-plugin-example --view
```
When you rename the plugin, be sure to rename its directory as well.
### Iterating
To speed up development, you can gather once and iterate by auditing repeatedly.
```sh
# Gather artifacts from the browser
NODE_PATH=.. npx lighthouse -- https://example.com --plugins=lighthouse-plugin-example --only-categories=lighthouse-plugin-example --gather-mode
# and then iterate re-running this:
NODE_PATH=.. npx lighthouse -- https://example.com --plugins=lighthouse-plugin-example --only-categories=lighthouse-plugin-example --audit-mode --view
```
Finally, publish to NPM.
## To run as a plugin user
1. Install `lighthouse` (v5+) and the plugin `lighthouse-plugin-example`, likely as `devDependencies`.
* `npm install -D lighthouse lighthouse-plugin-example`
1. To run your private lighthouse binary, you have three options
1. `npx --no-install lighthouse -- https://example.com --plugins=lighthouse-plugin-example --view`
1. `yarn lighthouse https://example.com --plugins=lighthouse-plugin-example --view`
1. Add an npm script calling `lighthouse` and run that.
## Result

---
# Source: https://github.com/GoogleChrome/lighthouse/blob/main/docs/recipes/type-checking/readme.md
# Lighthouse type checking recipe
This example project demonstrates how Lighthouse types can be imported into a node project.
`use-types.ts` is a basic user flow script that takes advantage of Lighthouse types and integrates with the version of Puppeteer installed.
---
# Source: https://github.com/GoogleChrome/lighthouse/blob/main/docs/releasing.md
### Release guide for maintainers
This doc is only relevant to core members.
## Release Policy
### Cadence
We aim to release every 4 week, one day after the [expected Chromium branch point](https://www.chromium.org/developers/calendar). These are Wednesdays.
Major version bumps will be the first release of April and October. The due date and progress of major milestones are tracked in https://github.com/GoogleChrome/lighthouse/milestones.
For example, following this schedule, we will attempt a release on these dates:
* _Sep 6 2023_ (Ships in M119, after M118 branch point)
* _Oct 4 2023_ (Ships in M120, after M119 branch point)
* ...
The planned ship dates are added to the internal Lighthouse calendar.
If a release is necessary outside these scheduled dates, we may choose to skip the next scheduled release.
In general, the above release dates are when new versions will be available in npm. Within 2 weeks, it will be reflected in LR / PSI. Some 10 weeks later, it will be available in Stable Chrome.
### Release manager
Release manager is appointed, according to the list below. However, if the appointed manager is absent, the next engineer in line in the list would own it.
@cjamcl, @adamraine
### Versioning
We follow [semver](https://semver.org/) versioning semantics (`vMajor.Minor.Patch`). Breaking changes will bump the major version. New features or bug fixes will bump the minor version. If a release contains no new features, then we'll only bump the patch version.
## Release Process
### Update various dependencies
In general, Lighthouse should be using the latest version of its critical dependencies. These are listed in the following script. It's ok to not be on the very latest, use your judgement.
```sh
# first, ask Paul to publish chrome-devtools-frontend
bash core/scripts/upgrade-deps.sh
```
### On the scheduled release date
Before starting, you should announce to the LH eng channel that you are releasing,
and that no new PRs should be merged until you are done.
### Lightrider
There is a cron that rolls the latest Lighthouse to the Lightrider canary feed.
Make sure it has run recently, and there were no errors that require an upstream
fix in Lighthouse
For more, see the internal README for updating Lighthouse: go/lightrider-doc
Hold on submitting a CL until after cutting a release.
### Open the PR
Now that the integrations are confirmed to work, go back to `lighthouse` folder.
```sh
# Prepare the commit, replace x.x.x with the desired version
bash ./core/scripts/release/prepare-commit.sh x.x.x
```
1. Edit changelog.md before opening the PR
1. Open the PR with title `vx.x.x`
1. Hold until approved and merged
### Cut the release
```sh
# Package everything for publishing.
bash ./core/scripts/release/prepare-package.sh
# Make sure you're in the Lighthouse pristine repo.
cd ../lighthouse-pristine
# Last chance to abort.
git status
git log
# Publish tag.
git push --tags
# Publish to npm.
npm publish
# Publish viewer and treemap.
yarn deploy-viewer
yarn deploy-treemap
```
### Extensions
The extensions rarely change. Run `git log clients/extension` to see the latest changes,
and re-publish them to the Chrome and Firefox extension stores if necessary.
To test:
- run `yarn build-extension`
- go to chrome://extensions/
- click "load packed", select `dist/extension-chrome-package`
- manually test it
To publish:
```sh
# Publish the extensions (if it changed).
open https://chrome.google.com/webstore/developer/edit/blipmdconlkpinefehnmjammfjpmpbjk
cd dist/extension-package/
echo "Upload the package zip to CWS dev dashboard..."
# Be in lighthouse-extension-owners group
# Open <https://chrome.google.com/webstore/developer/dashboard>
# Click _Edit_ on lighthouse
# _Upload Updated Package_
# Select `lighthouse-X.X.X.X.zip`
# _Publish_ at the bottom
# For Firefox: https://addons.mozilla.org/en-US/developers/addon/google-lighthouse/versions/submit/
```
### Chromium CL
```sh
git checkout vx.x.x # Checkout the specific version.
yarn devtools ~/src/devtools/devtools-frontend
cd ~/src/devtools/devtools-frontend
git new-branch rls
git commit -am "[Lighthouse] Roll Lighthouse x.x.x"
git cl upload -b 40543651
```
### Lightrider
Roll to Lightrider canary, and alert LR team that the next version is ready to be rolled to stable.
### Done
Yay!
---
# Source: https://github.com/GoogleChrome/lighthouse/blob/main/docs/running-at-scale.md
# Running Lighthouse at Scale
Many Lighthouse users want to collect Lighthouse data for hundreds or thousands of URLs daily. First, anyone interested should understand [how variability plays into web performance measurement](./variability.md) in the lab.
There are three primary options for gathering Lighthouse data at scale.
## Option 1: Using the PSI API
The default quota of the [PageSpeed Insights API](https://developers.google.com/speed/docs/insights/v5/get-started) is 25,000 requests per day. Of course, you can't test localhost or firewalled URLs using the PSI API, unless you use a security-concerning solution like [ngrok](https://ngrok.com/) to web-expose them.
A huge benefit of using the PSI API is that you don't need to create and maintain [a stable testing environment](./variability.md#run-on-adequate-hardware) for Lighthouse to run. The PSI API has Lighthouse running on Google infrastructure which offers good reproducibility.
* PRO: You don't need to maintain testing hardware.
* PRO: A simple network request returns complete Lighthouse results
* CON: The URLs must be web-accessible.
Approx eng effort: ~5 minutes for the first result. ~30 minutes for a script that evaluates and saves the results for hundreds of URLs.
## Option 2: Using the Lighthouse CLI on cloud hardware
The [Lighthouse CLI](https://github.com/GoogleChrome/lighthouse#using-the-node-cli) is the foundation of most advanced uses of Lighthouse and provides considerable configuration possibilities. For example, you could launch a fresh Chrome in a debuggable state (`chrome-debug --port=9222`) and then have Lighthouse repeatedly reuse the same Chrome. (`lighthouse <url> --port=9222`). That said, we wouldn't recommend this above a hundred loads, as state can accrue in a Chrome profile. Using a fresh profile for each Lighthouse run is the best approach for reproducible results.
Many teams have wrapped around the Lighthouse CLI with bash, python, or node scripts. The npm modules [multihouse](https://github.com/samdutton/multihouse) and [lighthouse-batch](https://www.npmjs.com/package/lighthouse-batch) both leverage this pattern.
You'll be running Lighthouse CLI on your own machines, and we have guidance on the [specs of machines suitable](./variability.md#run-on-adequate-hardware) for running Lighthouse without skewing performance results. The environment must also be able to run either headful Chrome or headless Chrome.
* PRO: Ultimate configurability
* CON: Must create and maintain testing environment
Approx eng effort: 1 day for the first result, after provisioning and setup. Another 2-5 days for calibrating, troubleshooting, handling interaction with cloud machines.
## Option 3: Gather data via a service that integrates Lighthouse
Many are listed in our readme: https://github.com/GoogleChrome/lighthouse#lighthouse-integrations-in-web-perf-services
---
# Source: https://github.com/GoogleChrome/lighthouse/blob/main/docs/scoring.md
# Lighthouse Scores
## How is the Performance score calculated?
➡️ Please read [Lighthouse Performance Scoring at developer.chrome.com](https://developer.chrome.com/docs/lighthouse/performance/performance-scoring/).
## How is the Best Practices score calculated?
All audits in the Best Practices category are equally weighted. Therefore, implementing each audit correctly will increase your overall score by ~6 points.
## How is the SEO score calculated?
All audits in the SEO category are [equally weighted](https://github.com/GoogleChrome/lighthouse/blob/main/core/config/default-config.js#:~:text=%7D%2C-,%27seo%27%3A,-%7B), with the exception of Structured Data, which is an unscored manual audit. Therefore, implementing each audit correctly will increase your overall score by ~8 points.
## How is the accessibility score calculated?
<!-- To regnerate score weights, run `node core/scripts/print-a11y-scoring.js`-->
The accessibility score is a weighted average. The specific weights for v7 are as follows:
(See the [v6 scoring explanation](https://github.com/GoogleChrome/lighthouse/blob/v6.5.0/docs/scoring.md#how-is-the-accessibility-score-calculated))
| audit id | weight |
|-|-|
| aria-allowed-attr | 4.1% |
| aria-hidden-body | 4.1% |
| aria-required-attr | 4.1% |
| aria-required-children | 4.1% |
| aria-required-parent | 4.1% |
| aria-roles | 4.1% |
| aria-valid-attr-value | 4.1% |
| aria-valid-attr | 4.1% |
| button-name | 4.1% |
| duplicate-id-aria | 4.1% |
| image-alt | 4.1% |
| input-image-alt | 4.1% |
| label | 4.1% |
| meta-refresh | 4.1% |
| meta-viewport | 4.1% |
| video-caption | 4.1% |
| accesskeys | 1.2% |
| aria-command-name | 1.2% |
| aria-hidden-focus | 1.2% |
| aria-input-field-name | 1.2% |
| aria-meter-name | 1.2% |
| aria-progressbar-name | 1.2% |
| aria-toggle-field-name | 1.2% |
| aria-tooltip-name | 1.2% |
| aria-treeitem-name | 1.2% |
| bypass | 1.2% |
| color-contrast | 1.2% |
| definition-list | 1.2% |
| dlitem | 1.2% |
| document-title | 1.2% |
| duplicate-id-active | 1.2% |
| frame-title | 1.2% |
| html-has-lang | 1.2% |
| html-lang-valid | 1.2% |
| link-name | 1.2% |
| list | 1.2% |
| listitem | 1.2% |
| object-alt | 1.2% |
| tabindex | 1.2% |
| td-headers-attr | 1.2% |
| th-has-data-cells | 1.2% |
| valid-lang | 1.2% |
| form-field-multiple-labels | 0.8% |
| heading-order | 0.8% |
Each audit is a pass/fail, meaning there is no room for partial points for getting an audit half-right. For example, that means if half your buttons have screenreader friendly names, and half do not, you don't get "half" of the weighted average - you get a 0 because it needs to be implemented correctly *throughout* the page.
---
# Source: https://github.com/GoogleChrome/lighthouse/blob/main/docs/throttling.md
# Network Throttling
Lighthouse applies network throttling to emulate the ~85th percentile mobile connection speed even when run on much faster fiber connections.
## The mobile network throttling preset
This is the standard recommendation for mobile throttling:
- Latency: 150ms
- Throughput: 1.6Mbps down / 750 Kbps up.
- Packet loss: none.
These exact figures are [defined in the Lighthouse constants](https://github.com/GoogleChrome/lighthouse/blob/main/core/config/constants.js#:~:text=of%204G%20connections.-,mobileSlow4G,-%3A%20%7B) and used as Lighthouse's throttling default.
They represent roughly the bottom 25% of 4G connections and top 25% of 3G connections (in Lighthouse this configuration is currently called "Slow 4G" but used to be labeled as "Fast 3G").
This preset is identical to the [WebPageTest's "Mobile 3G - Fast"](https://github.com/WPO-Foundation/webpagetest/blob/master/www/settings/connectivity.ini.sample) and, due to a lower latency, slightly faster for some pages than the [WebPageTest "4G" preset](https://github.com/WPO-Foundation/webpagetest/blob/master/www/settings/connectivity.ini.sample).
## Types of network throttling
Within web performance testing, there are four typical styles of network throttling:
1. **_Simulated throttling_**, which Lighthouse uses by **default**, uses a simulation of a page load, based on the data observed in the initial unthrottled load. This approach makes it both very fast and deterministic. However, due to the imperfect nature of predicting alternate execution paths, there is inherent inaccuracy that is summarized in this doc: [Lighthouse Metric Variability and Accuracy](https://docs.google.com/document/d/1BqtL-nG53rxWOI5RO0pItSRPowZVnYJ_gBEQCJ5EeUE/edit). The TLDR: while it's roughly as accurate or better than DevTools throttling for most sites, it suffers from edge cases and a deep investigation to performance should use _Packet-level_ throttling tools.
1. **_Request-level throttling_** , also referred to as **_DevTools throttling_** in the Lighthouse panel or _`devtools` throttling_ in Lighthouse configuration, is how throttling is implemented with Chrome DevTools. In real mobile connectivity, latency affects things at the packet level rather than the request level. As a result, this throttling isn't highly accurate. It also has a few more downsides that are summarized in [Network Throttling & Chrome - status](https://docs.google.com/document/d/1TwWLaLAfnBfbk5_ZzpGXegPapCIfyzT4MWuZgspKUAQ/edit). The TLDR: while it's a [decent approximation](https://docs.google.com/document/d/10lfVdS1iDWCRKQXPfbxEn4Or99D64mvNlugP1AQuFlE/edit), it's not a sufficient model of a slow connection. The [multipliers used in Lighthouse](https://github.com/GoogleChrome/lighthouse/blob/main/core/config/constants.js#:~:text=*%201024%2C-,requestLatencyMs,-%3A%20150%20*) attempt to correct for the differences.
1. **_Proxy-level_** throttling tools do not affect UDP data, so they're decent, but not ideal.
1. **_Packet-level_** throttling tools are able to make the most accurate network simulation. While this approach can model real network conditions most effectively, it also can introduce [more variance](https://docs.google.com/document/d/1BqtL-nG53rxWOI5RO0pItSRPowZVnYJ_gBEQCJ5EeUE/edit) than request-level or simulated throttling. [WebPageTest uses](https://github.com/WPO-Foundation/wptagent/blob/master/docs/remote_trafficshaping.md) packet-level throttling.
Lighthouse, by default, uses simulated throttling as it provides both quick evaluation and minimized variance. However, some may want to experiment with more accurate throttling... [Learn more about these throttling types and how they behave in in different scenarios](https://www.debugbear.com/blog/network-throttling-methods).
## DevTools' Lighthouse Panel Throttling
The Lighthouse panel has a simplified throttling setup:
1. _Simulated throttling_ remains the default setting. This matches the setup of PageSpeed Insights and the Lighthouse CLI default, maintaining cross-tool consistency.
- If you click the `View Original Trace` button, the trace values will not match up with Lighthouse's metric results, as the original trace is prior to the simulation.
1. _DevTools throttling_ is available within the Lighthouse panel settings (⚙): select _DevTools throttling_ from the throttling method dropdown.
- In this mode, the performance data seen after clicking the [`View Trace` button](https://developers.google.com/web/updates/2018/04/devtools#traces) will match Lighthouses's numbers.
Of course, CLI users can still control the exact [configuration](../readme.md#cli-options) of throttling.
## How do I get packet-level throttling?
This Performance Calendar article, [Testing with Realistic Networking Conditions](https://calendar.perfplanet.com/2016/testing-with-realistic-networking-conditions/), has a good explanation of packet-level traffic shaping (which applies across TCP/UDP/ICMP) and recommendations.
The [`@sitespeed.io/throttle`](https://www.npmjs.com/package/@sitespeed.io/throttle) npm package appears to be the most usable Mac/Linux commandline app for managing your network connection. Important to note: it changes your **entire** machine's network interface. Also, **`@sitespeed.io/throttle` requires `sudo`** (as all packet-level shapers do).
**Windows?** As of today, there is no single cross-platform tool for throttling. But there are two recommended **Windows 7** network shaping utilities: [WinShaper](https://calendar.perfplanet.com/2016/testing-with-realistic-networking-conditions/#introducing_winshaper) and [Clumsy](http://jagt.github.io/clumsy/).
For **Windows 10** [NetLimiter](https://www.netlimiter.com/buy/nl4lite/standard-license/1/0) (Paid option) and [TMeter](http://www.tmeter.ru/en/) (Freeware Edition) are the most usable solutions.
### `@sitespeed.io/throttle` set up
```sh
# Install with npm
npm install @sitespeed.io/throttle -g
# Ensure you have Node.js installed and npm is in your $PATH (https://nodejs.org/en/download/)
# To use the recommended throttling values:
throttle --up 768 --down 1638 --rtt 150
# or even simpler (using a predefined profile)
throttle 3gfast
# To disable throttling
throttle --stop
```
For more information and a complete list of features visit the documentation on [sitespeed.io website](https://www.sitespeed.io/documentation/throttle/).
### Using Lighthouse with `@sitespeed.io/throttle`
```sh
npm install @sitespeed.io/throttle -g
# Enable system traffic throttling
throttle 3gfast
# Run Lighthouse with its own network throttling disabled (while leaving CPU throttling)
lighthouse --throttling-method=devtools \
--throttling.requestLatencyMs=0 \
--throttling.downloadThroughputKbps=0 \
--throttling.uploadThroughputKbps=0 \
https://example.com
# Disable the traffic throttling once you see "Gathering trace"
throttle --stop
```
# CPU Throttling
Lighthouse applies CPU throttling to emulate a mid-tier mobile device even when run on far more powerful desktop hardware.
## Benchmarking CPU Power
Unlike network throttling where objective criteria like RTT and throughput allow targeting of a specific environment, CPU throttling is expressed relative to the performance of the host device. This poses challenges to [variability in results across devices](./variability.md), so it's important to calibrate your device before attempting to compare different reports.
Lighthouse computes and saves a `benchmarkIndex` as a rough approximation of the host device's CPU performance with every report. You can find this value under the title "CPU/Memory Power" at the bottom of the Lighthouse report:
<img src="https://user-images.githubusercontent.com/2301202/96950078-1b03d380-14af-11eb-9583-fbf8133315b2.png" alt="Screenshot of CPU/Memory Power in Lighthouse report" width=600 border=1 />
**NOTE:** In Lighthouse 6.3 BenchmarkIndex changed its definition to better align with changes in Chrome 86. Benchmark index values prior to 6.3 and Chrome 86 may differ.
Below is a table of various device classes and their approximate ranges of `benchmarkIndex` as of Chrome m86 along with a few other benchmarks. The amount of variation in each class is quite high. Even the same device can be purchased with multiple different processors and memory options.
| - | High-End Desktop | Low-End Desktop | High-End Mobile | Mid-Tier Mobile | Low-End Mobile |
| ----------------------------------- | ---------------- | --------------- | --------------- | --------------- | ----------------- |
| Example Device | 16" Macbook Pro | Intel NUC i3 | Samsung S10 | Moto G4 | Samsung Galaxy J2 |
| **Lighthouse BenchmarkIndex** | 1500-2000 | 1000-1500 | 800-1200 | 125-800 | <125 |
| Octane 2.0 | 30000-45000 | 20000-35000 | 15000-25000 | 2000-20000 | <2000 |
| Speedometer 2.0 | 90-200 | 50-90 | 20-50 | 10-20 | <10 |
| JavaScript Execution of a News Site | 2-4s | 4-8s | 4-8s | 8-20s | 20-40s |
## Calibrating the CPU slowdown
By default, Lighthouse uses **a constant 4x CPU multiplier** which moves a typical run in the high-end desktop bracket somewhere into the mid-tier mobile bracket.
You may choose to calibrate if your benchmarkIndex is in a different range than the above table would expect. Additionally, when Lighthouse is run from the CLI with default settings on an underpowered device, a warning will be added to the report suggesting you calibrate the slowdown:

The `--throttling.cpuSlowdownMultiplier` CLI flag allows you to configure the throttling level applied. On a weaker machine, you can lower it from the default of 4x to something more appropriate.
The [Lighthouse CPU slowdown calculator webapp](https://lighthouse-cpu-throttling-calculator.vercel.app/) will compute what multiplier to use from the `CPU/Memory Power` value from the bottom of the report.
<a href="https://lighthouse-cpu-throttling-calculator.vercel.app/">
<img src="https://user-images.githubusercontent.com/39191/101436708-8a991b00-38c3-11eb-89c5-7d43752932e9.png" width=300>
</a>
Alternatively, consider the below table of the various `cpuSlowdownMultiplier`s you might want to use to target different devices along with the possible range:
| - | High-End Desktop | Low-End Desktop | High-End Mobile | Mid-Tier Mobile | Low-End Mobile |
| ---------------- | ---------------- | --------------- | --------------- | --------------- | -------------- |
| High-End Desktop | 1x | 2x (1-4) | 2x (1-4) | 4x (2-10) | 10x (5-20) |
| Low-End Desktop | - | 1x | 1x | 2x (1-5) | 5x (3-10) |
| High-End Mobile | - | - | 1x | 2x (1-5) | 5x (3-10) |
| Mid-Tier Mobile | - | - | - | 1x | 2x (1-5) |
| Low-End Mobile | - | - | - | - | 1x |
If your device's BenchmarkIndex falls on the _higher_ end of its bracket, use a _higher_ multiplier from the range in the table. If your device's BenchmarkIndex falls on the _lower_ end of its bracket, use a _lower_ multiplier from the range in the table. If it's somewhere in the middle, use the suggested multiplier.
```bash
# Run Lighthouse with a custom CPU slowdown multiplier
lighthouse --throttling.cpuSlowdownMultiplier=6 https://example.com
```
## Types of CPU Throttling
Within web performance testing, there are two typical styles of CPU throttling:
1. **_Simulated throttling_**, which Lighthouse uses by **default**, uses a simulation of a page load, based on the data observed in the initial unthrottled load. This approach makes it very fast. However, due to the imperfect nature of predicting alternate execution paths, there is inherent inaccuracy that is summarized in this doc: [Lighthouse Metric Variability and Accuracy](https://docs.google.com/document/d/1BqtL-nG53rxWOI5RO0pItSRPowZVnYJ_gBEQCJ5EeUE/edit). The TLDR: while it's fairly accurate for most circumstances, it suffers from edge cases and a deep investigation to performance should use _DevTools_ CPU throttling tools.
1. **_DevTools throttling_** , also called _`devtools` throttling_ in Lighthouse configuration. This method actually interrupts execution of CPU work at periodic intervals to emulate a slower processor. It is [fairly accurate](https://docs.google.com/document/d/1jGHeGjjjzfTAE2WHXipKF3aqwF2bFA6r0B877nFtBpc/edit) and much easier than obtaining target hardware. The same underlying principle can be used by [linux cgroups](https://www.kernel.org/doc/html/latest/scheduler/sched-bwc.html) to throttle any process, not just the browser. Other tools like [WebPageTest use CPU throttling](https://github.com/WPO-Foundation/wptagent/commit/f7fe0d6b5b01bd1b042a1fe3144c68a6bff846a6) offered by DevTools.
---
# Source: https://github.com/GoogleChrome/lighthouse/blob/main/docs/understanding-results.md
# Understanding the Results
The result object contains all the audit information Lighthouse determined about the page. In fact, everything you see in the HTML report, even the screenshots, is a rendering of information contained in the result object. You might need to work directly with the result object if you use [Lighthouse programmatically](https://github.com/GoogleChrome/lighthouse/blob/main/docs/readme.md#using-programmatically), consume the JSON output of the [CLI](https://github.com/GoogleChrome/lighthouse#using-the-node-cli), explore [Lighthouse results in HTTPArchive](https://github.com/GoogleChrome/lighthouse#lighthouse-integrations), or work on the report generation code that reads the Lighthouse JSON and outputs HTML.
## Lighthouse Result Object (LHR)
The top-level Lighthouse Result object (LHR) is what the lighthouse node module returns and the entirety of the JSON output of the CLI. It contains some metadata about the run and the results in the various subproperties below.
For an always up-to-date definition of the LHR, take a look [at our typedefs](https://github.com/GoogleChrome/lighthouse/blob/main/types/lhr/lhr.d.ts).
### Properties
| Name | Description |
| - | - |
| lighthouseVersion | The version of Lighthouse with which this result was generated. |
| fetchTime | The ISO-8601 timestamp of when the result was generated. |
| userAgent | The user agent string of the version of Chrome that was used by Lighthouse. |
| requestedUrl | The URL that was supplied to Lighthouse and initially navigated to. |
| mainDocumentUrl | The URL of the main document request during the final page navigation. |
| finalDisplayedUrl | The URL displayed on the page after all redirects, history API updates, etc. |
| [audits](#audits) | An object containing the results of the audits. |
| [configSettings](#config-settings) | An object containing information about the configuration used by Lighthouse. |
| [timing](#timing) | An object containing information about how long Lighthouse spent auditing. |
| [categories](#categories) | An object containing the different categories, their scores, and references to the audits that comprise them. |
| [categoryGroups](#category-groups) | An object containing the display groups of audits for the report. |
| runtimeError | An object `{code: string, message: string};` providing a top-level error message that, if present, indicates a serious enough problem that this Lighthouse result may need to be discarded. |
| runWarnings | Array of top-level warnings for this Lighthouse run. |
### Example
```json
{
"lighthouseVersion": "5.1.0",
"fetchTime": "2019-05-05T20:50:54.185Z",
"userAgent": "Mozilla/5.0 (Macintosh; Intel Mac OS X 10_13_3) AppleWebKit/537.36 (KHTML, like Gecko) Chrome/66.0.3358.0 Safari/537.36",
"requestedUrl": "http://example.com",
"mainDocumentUrl": "https://www.example.com/",
"finalDisplayedUrl": "https://www.example.com/",
"audits": {...},
"configSettings": {...},
"timing": {...},
"categories": {...},
"categoryGroups": {...},
}
```
<a name="audits"></a>
## `audits`
An object containing the results of the audits, keyed by their name.
### Audit Properties
| Name | Type | Description |
| -- | -- | -- |
| id | `string` | The string identifier of the audit in kebab case. |
| title | `string` | The display name of the audit. The text can change depending on if the audit passed or failed. It may contain markdown code. |
| description | `string` | A more detailed description that describes why the audit is important and links to Lighthouse documentation on the audit, markdown links supported. |
| explanation | <code>string|undefined</code> | A string indicating the reason for audit failure. |
| warnings | <code>string[]|undefined</code> | Messages identifying potentially invalid cases |
| errorMessage | <code>string|undefined</code> | A message set |
| numericValue | <code>number|undefined</code> | The unscored value determined by the audit. Typically this will match the score if there's no additional information to impart. For performance audits, this value is typically a number indicating the metric value. |
| displayValue | <code>string|undefined</code> | The string to display in the report alongside audit results. If empty, nothing additional is shown. This is typically used to explain additional information such as the number and nature of failing items. |
| score | <code>number|null</code> | The scored value determined by the audit provided in the numeric range `0-1`, or null if `scoreDisplayMode` indicates not scored. |
| scoreDisplayMode | <code>"binary" | "numeric" | "error" | "manual" | "notApplicable" | "informative"</code> | A string identifying how the score should be interpreted for display i.e. is the audit pass/fail (score of 1 or 0), did it fail, should it be ignored, or are there shades of gray (scores between 0-1 inclusive). If set as `informative`, `notApplicable`, `manual`, or `error`, then `score` will be null and should be ignored. |
| details | `Object` | Extra information found by the audit necessary for display. The structure of this object varies from audit to audit. The [structure of this object](https://github.com/GoogleChrome/lighthouse/blob/main/types/lhr/audit-details.d.ts) is somewhat stable between minor version bumps as this object is used to render the HTML report. |
### Example
```json
{
"is-on-https": {
"id": "is-on-https",
"title": "Does not use HTTPS",
"description": "All sites should be protected with HTTPS, even ones that don't handle sensitive data. HTTPS prevents intruders from tampering with or passively listening in on the communications between your app and your users, and is a prerequisite for HTTP/2 and many new web platform APIs. [Learn more](https://developers.google.com/web/tools/lighthouse/audits/https).",
"score": 0,
"scoreDisplayMode": "binary",
"displayValue": "1 insecure request found",
"details": {
"type": "table",
"headings": [
{
"key": "url",
"valueType": "url",
"label": "Insecure URL"
}
],
"items": [
{
"url": "http://ajax.googleapis.com/ajax/libs/jquery/2.1.1/jquery.min.js"
}
]
}
},
},
"custom-audit": {
"name": "custom-audit",
...
}
}
```
<a name="config-settings"></a>
## `configSettings`
An object containing information about the configuration used by Lighthouse.
### Example
```json
{
"output": [
"json"
],
"maxWaitForLoad": 45000,
"throttlingMethod": "devtools",
"throttling": {
"rttMs": 150,
"throughputKbps": 1638.4,
"requestLatencyMs": 562.5,
"downloadThroughputKbps": 1474.5600000000002,
"uploadThroughputKbps": 675,
"cpuSlowdownMultiplier": 4
},
"gatherMode": false,
"disableStorageReset": false,
"formFactor": "mobile",
"blockedUrlPatterns": null,
"additionalTraceCategories": null,
"extraHeaders": null,
"onlyAudits": null,
"onlyCategories": null,
"skipAudits": null
}
```
<a name="timing"></a>
## `timing`
An object containing information about how long Lighthouse spent auditing.
### Properties
| Name | Type | Description |
| -- | -- | -- |
| total | `number` | The total time spent in milliseconds loading the page and evaluating audits. |
### Example
```json
{
"total": 32189
}
```
<a name="categories"></a>
## `categories`
An array containing the different categories, their scores, and the results of the audits in the categories.
### CategoryEntry Properties
| Name | Type | Description |
| -- | -- | -- |
| id | `string` | The string identifier of the category. |
| title | `string` | The human-friendly display name of the category. |
| description | `string` | A brief description of the purpose of the category, supports markdown links. |
| score | `number` | The overall score of the category, the weighted average of all its audits. |
| auditRefs | `AuditEntry[]` | An array of all the audit results in the category. |
### AuditEntry Properties
| Name | Type | Description |
| -- | -- | -- |
| id | `string` | The string identifier of the category. |
| weight | `number` | The weight of the audit's score in the overall category score. |
| group | `string` | |
### Example
```json
{
"seo": {
"id": "seo",
"title": "SEO",
"description": "These checks ensure that your page is following basic search engine optimization advice...",
"score": 0.54,
"auditRefs": [
{
"id": "crawlable-anchors",
"weight": 1
}
]
}
}
```
<a name="category-groups"></a>
## `categoryGroups`
An object containing the display groups of audits for the report, keyed by the group ID found in the config.
### GroupEntry Properties
| Name | Type | Description |
| -- | -- | -- |
| title | `string` | The title of the display group. |
| description | `string` | A brief description of the purpose of the display group. |
### Example
```json
{
"metrics": {
"title": "Metrics",
"description": "These metrics are super cool."
},
}
```
---
# Source: https://github.com/GoogleChrome/lighthouse/blob/main/docs/user-flows.md
# User Flows in Lighthouse
Historically, Lighthouse has analyzed the cold pageload of a page. Starting in 2022 (Lighthouse v10), it can analyze and report on the entire page lifecycle via "user flows".
#### You might be interested in flows if…
* … you want to run Lighthouse on your whole webapp, not just the landing page.
* … you want to know if all parts of the web experience are accessible (e.g. a checkout process).
* … you want to know the Cumulative Layout Shift of my SPA page transition
In these cases, you want Lighthouse on a _flow_, not just a page load.
## The three modes: Navigation, Timespan, Snapshot
Lighthouse can now run in three modes: navigations, timespans, and snapshots. Each mode has its own unique use cases, benefits, and limitations. Later, you'll create a flow by combining these three core report types.
* **Navigation mode** analyzes a single page load. It should feel familiar as all Lighthouse runs prior to v9.6.0 were essentially in this mode. Even in v9.6.0 and onwards, it remains the default.
* **Timespan mode** analyzes an arbitrary period of time, typically containing user interactions.
* **Snapshot mode** analyzes the page in a particular state.
| | |
|:---:|---|
| Navigation <br> <img src="https://user-images.githubusercontent.com/39191/170560057-4f7cab97-ee6b-497f-8e18-1f84ba3616dd.png" height="96" width="141"> | **Use Cases** <br> ✅ Obtain a Lighthouse Performance score and all performance metrics.<br>✅ Assess Progressive Web App capabilities.<br>✅ Analyze accessibility immediately after page load.<br><br> **Limitations** <br> 🤔 Cannot analyze form submissions or single page app transitions.<br>🤔 Cannot analyze content that isn't available immediately on page load. |
| Timespan <br> <img src="https://user-images.githubusercontent.com/39191/170560055-fb599418-c94d-44bf-9921-be4dce6abccf.png" height="96" width="141"> | **Use Cases** <br> ✅ Measure layout shifts and JavaScript execution time over a timerange including interactions.<br>✅ Discover performance opportunities to improve the experience for long-lived pages and SPAs.<br><br> **Limitations** <br> 🤔 Does not provide an overall performance score.<br>🤔 Cannot analyze moment-based performance metrics (e.g. Largest Contentful Paint).<br>🤔 Cannot analyze state-of-the-page issues (e.g. no Accessibility category) |
| Snapshot <br> <img src="https://user-images.githubusercontent.com/39191/170560049-a6b630a2-187a-4233-9f8b-8d7fb276f51e.png" height="96" width="141"> | **Use Cases** <br> ✅ Analyze the page in its current state.<br> ✅ Find accessibility issues deep within SPAs or complex forms.<br>✅ Evaluate best practices of menus and UI elements hidden behind interaction.<br><br> **Limitations** <br> 🤔 Does not provide an overall performance score or metrics.<br>🤔 Cannot analyze any issues outside the current DOM (e.g. no network, main-thread, or performance analysis). |
### Navigation mode
<img src="https://user-images.githubusercontent.com/39191/170560057-4f7cab97-ee6b-497f-8e18-1f84ba3616dd.png">
In DevTools, navigation is easy: ensure it's the selected mode and then click _Analyze page load_.

> Note: DevTools only generates a report for a standalone navigation. To combine it with other steps for a multi-step user flow report, [use the Node API](#creating-a-flow).
#### Navigations in the Node.js API
```js
import {writeFileSync} from 'fs';
import puppeteer from 'puppeteer';
import {startFlow} from 'lighthouse';
const browser = await puppeteer.launch();
const page = await browser.newPage();
const flow = await startFlow(page);
// Navigate with a URL
await flow.navigate('https://example.com');
// Interaction-initiated navigation via a callback function
await flow.navigate(async () => {
await page.click('a.link');
});
// Navigate with startNavigation/endNavigation
await flow.startNavigation();
await page.click('a.link');
await flow.endNavigation();
await browser.close();
writeFileSync('report.html', await flow.generateReport());
```
</details>
<br>
##### Triggering a navigation via user interactions
Instead of providing a URL to navigate to, you can provide a callback function or use `startNavigation`/`endNavigation`, as seen above. This is useful when you want to audit a navigation that's initiated by a scenario like a button click or form submission.
> Aside: Lighthouse typically clears out any active Service Worker and Cache Storage for the origin under test. However, in this case, as it doesn't know the URL being analyzed, Lighthouse cannot clear this storage. This generally reflects the real user experience, but if you still wish to clear the Service Workers and Cache Storage you must do it manually.
This callback function _must_ perform an action that will trigger a navigation. Any interactions completed before the callback promise resolves will be captured by the navigation.
The `startNavigation`/`endNavigation` functions _must_ surround an action that triggers a navigation. Any interactions completed after `startNavigation` is invoked and before `endNavigation` is invoked will be captured by the navigation.
### Timespan
<img src="https://user-images.githubusercontent.com/39191/170560055-fb599418-c94d-44bf-9921-be4dce6abccf.png">
In DevTools, select "Timespan" as the mode and click _Start timespan_. Record whatever timerange or interactions is desired and then click _End timespan_.

#### Timespans in the Node.js API
```js
import {writeFileSync} from 'fs';
import puppeteer from 'puppeteer';
import {startFlow} from 'lighthouse';
const browser = await puppeteer.launch();
const page = await browser.newPage();
await page.goto('https://secret.login');
const flow = await startFlow(page);
await flow.startTimespan();
await page.type('#password', 'L1ghth0useR0cks!');
await page.click('#login');
await page.waitForSelector('#dashboard');
await flow.endTimespan();
await browser.close();
writeFileSync('report.html', await flow.generateReport());
```
</details>
<br>
### Snapshot
<img src="https://user-images.githubusercontent.com/39191/170560049-a6b630a2-187a-4233-9f8b-8d7fb276f51e.png">
In DevTools, select "Snapshot" as the mode. Set up the page in the state you want to evaluate. Then, click _Analyze page state_.

#### Snapshots in the Node.js API
```js
import {writeFileSync} from 'fs';
import puppeteer from 'puppeteer';
import {startFlow} from 'lighthouse';
const browser = await puppeteer.launch();
const page = await browser.newPage();
await page.goto('https://example.com');
const flow = await startFlow(page);
await page.click('#expand-sidebar');
await flow.snapshot();
await browser.close();
writeFileSync('report.html', await flow.generateReport());
```
</details>
<br>
## Creating a Flow
<img src="https://user-images.githubusercontent.com/39191/170560932-f10c8465-de49-4e75-be6c-1cf408cf84f6.png" height=240>
So far we've seen individual Lighthouse modes in action. The true power of flows comes from combining these building blocks into a comprehensive flow to capture the user's entire experience. Analyzing a multi-step user flow is currently only available [using the Lighthouse Node API along with Puppeteer](https://web.dev/articles/lighthouse-user-flows).
When mapping a user flow onto the Lighthouse modes, strive for each report to have a narrow focus. This will make debugging much easier when you have issues to fix!
--------
The below example codifies a user flow for an ecommerce site where the user navigates to the homepage, searches for a product, and clicks on the detail link.
<img alt="Lighthouse User Flows Diagram" src="https://user-images.githubusercontent.com/39191/168932574-944757d8-d110-4777-a01f-0ec27d65719a.png" height="550">
### Complete user Flow Code
```js
import puppeteer from 'puppeteer';
import {startFlow} from 'lighthouse';
import {writeFileSync} from 'fs';
// Setup the browser and Lighthouse.
const browser = await puppeteer.launch();
const page = await browser.newPage();
const flow = await startFlow(page);
// Phase 1 - Navigate to the landing page.
await flow.navigate('https://web.dev/');
// Phase 2 - Interact with the page and submit the search form.
await flow.startTimespan();
await page.click('button[search-open]');
const searchBox = await page.waitForSelector('devsite-search[search-active] input');
await searchBox.type('CLS');
await searchBox.press('Enter');
// Ensure search results have rendered before moving on.
const link = await page.waitForSelector('devsite-content a[href="https://web.dev/articles/cls"]');
await flow.endTimespan();
// Phase 3 - Analyze the new state.
await flow.snapshot();
// Phase 4 - Navigate to the article.
await flow.navigate(async () => {
await link.click();
});
// Get the comprehensive flow report.
writeFileSync('report.html', await flow.generateReport());
// Save results as JSON.
writeFileSync('flow-result.json', JSON.stringify(await flow.createFlowResult(), null, 2));
// Cleanup.
await browser.close();
```
As this flow has multiple steps, the flow report summarizes everything and allows you to investigate each aspect in more detail.

### Creating a desktop user flow
If you want to test the desktop version of a page with user flows, you can use the desktop config provided in the Lighthouse package, which includes desktop scoring and viewport/performance emulation.
```js
import puppeteer from 'puppeteer';
import {startFlow, desktopConfig} from 'lighthouse';
const browser = await puppeteer.launch();
const page = await browser.newPage();
const flow = await startFlow(page, {
config: desktopConfig,
});
await flow.navigate('https://example.com');
```
### Using Puppeteer's emulation settings in a user flow
If you want to inherit the viewport settings set up by Puppeteer, you need to disable Lighthouse's viewport emulation in the `flags` option.
If Puppeteer is emulating a desktop page make sure to use the `desktopConfig` so Lighthouse still scores the results as a desktop page.
```js
import puppeteer from 'puppeteer';
import {startFlow, desktopConfig} from 'lighthouse';
const browser = await puppeteer.launch();
const page = await browser.newPage();
const flow = await startFlow(page, {
// Puppeteer is emulating a desktop environment,
// so we should still use the desktop config.
//
// If Puppeteer is emulating a mobile device then we can remove the next line.
config: desktopConfig,
// `flags` will override the Lighthouse emulation settings
// to prevent Lighthouse from changing the screen dimensions.
flags: {screenEmulation: {disabled: true}},
});
await page.setViewport({width: 1000, height: 500});
await flow.navigate('https://example.com');
```
## Tips and Tricks
- Keep timespan recordings _short_ and focused on a single interaction sequence or page transition.
- Always audit page navigations with navigation mode, avoid auditing hard page navigations with timespan mode.
- Use snapshot recordings when a substantial portion of the page content has changed.
- Always wait for transitions and interactions to finish before ending a timespan. The puppeteer APIs `page.waitForSelector`/`page.waitForFunction`/`page.waitForResponse`/`page.waitForTimeout` are your friends here.
## Related Reading
- [User Flows Issue](https://github.com/GoogleChrome/lighthouse/issues/11313)
- [User Flows Design Document](https://docs.google.com/document/d/1fRCh_NVK82YmIi1Zq8y73_p79d-FdnKsvaxMy0xIpNw/edit#heading=h.b84um9ao7pg7)
- [User Flows Timeline Diagram](https://docs.google.com/drawings/d/1jr9smqqSPsLkzZDEyFj6bvLFqi2OUp7_NxqBnqkT4Es/edit?usp=sharing)
- [User Flows Decision Tree Diagram](https://whimsical.com/lighthouse-flows-decision-tree-9qPyfx4syirwRFH7zdUw8c)
---
# Source: https://github.com/GoogleChrome/lighthouse/blob/main/docs/v8-perf-faq.md
# v8.0 Performance FAQ
### Give me a summary of the perf score changes in v8.0. What's new/different?
First, it may be useful to refresh on [the math behind Lighthouse's metric
scores and performance score.](https://developer.chrome.com/docs/lighthouse/performance/performance-scoring/)
In [Lighthouse v8.0](https://github.com/GoogleChrome/lighthouse/releases/tag/v8.0.0), we updated the score curves for FCP and TBT measurements,
making both a bit more strict. CLS has been updated to its new, [windowed
definition](https://web.dev/articles/evolving-cls). Additionally, the Performance
Score's weighted average was
[rebalanced](https://googlechrome.github.io/lighthouse/scorecalc/#FCP=3000&SI=5800&FMP=4000&TTI=7300&FCI=6500&LCP=4000&TBT=600&CLS=0.25&device=mobile&version=8&version=6&version=5),
giving more weight to CLS and TBT than before, and slightly decreasing the
weights of FCP, SI, and TTI.
From an analysis of HTTP Archive's latest [crawl of the
web](https://httparchive.org/faq#how-does-the-http-archive-decide-which-urls-to-test),
we project that the performance score for the majority of sites will stay the
same or improve in Lighthouse 8.0.
- ~20% of sites may see a drop of up to 5 points, though likely less
- ~20% of sites will see little detectable change
- ~30% of sites should see a moderate improvement of a few points
- ~30% could see a significant improvement of 5 points or more
The biggest drops in scores are due to TBT scoring becoming stricter and the
metric's slightly higher weight. The biggest improvements in scores are also due
to TBT changes in the long tail and the windowing of CLS, and both metrics'
higher weights.
### What are the exact score weighting changes?
#### Changes by metric
| metric | v6 weight | v8 weight | Δ |
|--------------------------------|-----------|-----------|----------|
| First Contentful Paint (FCP) | 15 | **10** | -5 |
| Speed Index (SI) | 15 | **10** | -5 |
| Largest Contentful Paint (LCP) | 25 | **25** | 0 |
| Time To Interactive (TTI) | 15 | **10** | -5 |
| Total Blocking Time (TBT) | 25 | **30** | 5 |
| Cumulative Layout Shift (CLS) | 5 | **15** | 10 |
#### Changes by phase
| phase | metric | v6 phase weight | v8 phase weight | Δ |
|----------------|--------------------------------|-----------------|-----------------|-----|
| early | First Contentful Paint (FCP) | 15 | 10 | -5 |
| mid | Speed Index (SI) | 40 | 35 | -5 |
| | Largest Contentful Paint (LCP) | | | |
| interactivity | Time To Interactive (TTI) | 40 | 40 | 0 |
| | Total Blocking Time (TBT) | | | |
| predictability | Cumulative Layout Shift (CLS) | 5 | 15 | 10 |
### Why did the weight of CLS go up?
When introduced in Lighthouse v6, it was still early days for the metric.
There've been [many improvements and
bugfixes](https://chromium.googlesource.com/chromium/src/+/refs/heads/main/docs/speed/metrics_changelog/cls.md)
to the CLS metric since then. Now, given its maturity and established placement in Core
Web Vitals, the weight increases from 5% to 15%.
### Why are the Core Web Vitals metrics weighted differently in the performance score?
The Core Web Vitals metrics are [independent signals in the Page Experience
ranking
update](https://support.google.com/webmasters/thread/104436075/core-web-vitals-page-experience-faqs-updated-march-2021).
Lighthouse weighs each lab equivalent metric based on what we believe creates
the best incentives to improve overall page experience for users.
LCP, CLS, and TBT are [very good
metrics](https://chromium.googlesource.com/chromium/src/+/lkgr/docs/speed/good_toplevel_metrics.md)
and that's why they are the three highest-weighted metrics in the performance
score.
### How should I think about the Lighthouse performance score in relation to Core Web Vitals?
[Core Web Vitals](https://web.dev/articles/vitals) refer to a specific set of key user
experience metrics, their passing thresholds, and percentile at which they're measured.
In general, CWV's primary focus is field data.
The Lighthouse score is a means to understand the degree of opportunity
available to improve critical elements of user experience. The lower the score,
the more likely the user will struggle with load performance, responsiveness, or
content stability.
Lighthouse's lab-based data overlaps with Core Web Vitals in a few key ways.
Lighthouse features two of the three core vitals (LCP and CLS) with the exact
same passing thresholds. There's no user input in a Lighthouse run, so it cannot
compute FID. Instead, we have TBT, which you can consider a proxy metric for
FID, and though they measure two different things they are both signals about a
page's interactivity.
_So CWV and Lighthouse have commonalities, but are different. How can you
rationalize paying attention to both?_
Ultimately, a combination approach is most effective. Use field data for the
long-term overview of your user's experience, and use lab data to iterate your
way to the best experience possible for your users. CrUX data summarizes [the
most recent 28
days](https://developers.google.com/web/tools/chrome-user-experience-report/api/reference#data-pipeline),
so it'll take some time to confidently determine that any change has definite
impact.
Lighthouse's analysis allows you to debug and optimize in an environment that is
repeatable with an immediate feedback loop. In addition, lab-based tooling can
provide significantly more detail than field instrumentation, as it's not
limited to web-exposed APIs and cross-origin restrictions.
The exact numbers of your lab and field metrics aren't expected to match, but
any substantial improvement to your lab metrics should be observable in the
field once it's been deployed. The higher the Lighthouse score, the less you're
leaving up to chance in the field.
### What blindspots from the field can lab tooling illuminate?
Field data analyzes all successful page loads. But if failed and aborted loads
are excluded, or reporting is blocked by extensions, the collected field data
can suffer from survivorship bias. Users who have better experiences use your
site more; that's why we care about performance in the first place! Lab tooling
shows you the quality of the experience for these users that field data might be
[missing entirely](https://blog.chriszacharias.com/page-weight-matters).
Lighthouse mobile reports emulate a slow 4G connection on a mid-tier Android
device. While field data might not indicate these conditions are especially
common for your site, analyzing how your site performs in these tougher
conditions helps expand your site's audience. Lighthouse identifies the worst
experiences, experiences you can't see in the field because they were so bad the
user never came back (or waited around in the first place).
As always, using both lab and field data to understand and optimize your user
experience is best practice. [Read more about field & lab](https://developers.google.com/web/fundamentals/performance/speed-tools).
### How should I work to optimize CLS differently given that it has been updated?
The [windowing adjustment](https://web.dev/articles/evolving-cls)
will likely not have much effect for the lab measurement, but instead will have
a large effect on the field CLS for long-lived pages.
Lighthouse 8 introduces another adjustment to our CLS definition: including
layout shift contributions from subframes. This brings our implementation in
line with how CrUX computes field CLS. This comes with the implication that
iframes (including ones you may not control) may be adding layout shifts which
ultimately affect your CLS score. Keep in mind that the subframe contributions
are [weighted by the in-viewport
portion](https://github.com/WICG/layout-instability#cumulative-scores) of the
iframe.
### Why don't the numbers for TBT and FID match, if TBT is a proxy metric for FID?
The commonality between TBT (collected in a lab environment) and FID (collected
in a field context) is that they measure the impact on input responsiveness from
long tasks on the main thread. Beyond that, they're quite different. FID
captures the delay in handling the first input event of the page, whenever that
input happened. TBT roughly captures how dangerous the length of all the main
thread's tasks are.
It's very possible to have a page that does well on FID, but poorly on TBT. And
it's slightly harder, but possible, to do well on TBT but poorly on FID\*. So,
you shouldn't expect your TBT and FID measurements to correlate strongly. A
large-scale analysis found their [Spearman's
ρ](https://en.wikipedia.org/wiki/Spearman%27s_rank_correlation_coefficient) at
about 0.40, which indicates a connection, but not one as strong as many would
prefer.
From the Lighthouse project's perspective, the current passing threshold for FID
is quite lenient but more importantly, the percentile-of-record for FID (75th
percentile) is not sufficient for detecting issues. The 95th percentile is a
much stronger indicator of problematic interactions for this metric. We
encourage user-centric teams to focus on the 95th percentile of all input delays
(not just the first) in their field data in order to identify and address
problems that surface just 5% of the time.
\*Aside: the [Chrome 91 FID change for
double-tap-to-zoom](https://chromium.googlesource.com/chromium/src.git/+/refs/heads/main/docs/speed/metrics_changelog/2021_05_fid.md)
fixes a lot of high FID / low TBT cases and may be observable in your field
metrics, with higher percentiles improving slightly. Most remaining high FID /
low TBT cases are likely due to incorrect meta viewport tags, which [Lighthouse
will flag](https://developer.chrome.com/docs/lighthouse/pwa/viewport/).
Delivering a mobile-friendly viewport, reducing main-thread blocking JS, and
keeping your TBT low is the best defense against bad FID in the field.
### Overall, what motivated the changes to the performance score?
As with all Lighthouse score updates, changes are made to reflect
the latest in how to measure user-experience quality holistically and accurately,
and to focus attention on key priorities.
Heavy JS and long tasks are a problem for the web that's
[worsening](https://httparchive.org/reports/state-of-javascript#bytesJs). Field
FID is currently too lenient and not sufficiently incentivizing action to
address the problem. Lighthouse has historically weighed its interactivity
metrics at 40-55% of the performance score and—as interactivity is key to user
experience—we maintain a 40% weighting (TBT and TTI together) in Lighthouse
8.0.
[FCP's score curve was
adjusted](https://github.com/GoogleChrome/lighthouse/pull/12556) to align with
the current de facto ["good" threshold](https://web.dev/articles/fcp#what_is_a_good_fcp_score),
and as a result will score a bit more strictly.
The curve for TBT was made stricter to [more closely
approach](https://github.com/GoogleChrome/lighthouse/pull/12576) the ideal score
curve. TBT has had (and still has) a more lenient curve than our methodology
dictates, but the new curve is more linear which means there's a larger range
where improvements in the metric are rewarded with improvements in the score. If
your page currently scores poorly with TBT, the new curve will be more
responsive to changes as page performance incrementally improves.
FCP's weight drops slightly from 15% to 10% because it's fairly gameable and is also partly
captured by Speed Index.
### What's the story with TTI?
TTI serves a useful role as it's the largest metric value reported (often >10
seconds) and helps anchor perceptions.
We see TBT as a stronger metric for evaluating the health of your main thread
and its impact on interactivity, plus it [has lower
variability](https://docs.google.com/document/d/1xCERB_X7PiP5RAZDwyIkODnIXoBk-Oo7Mi9266aEdGg/edit).
TTI serves as a nice complement that captures the cost of long tasks, often
from heavy JavaScript. That said, we expect to continue to reduce the weight
of TTI and will likely remove it in a future major Lighthouse release.
### How does the Lighthouse Perf score get calculated? What is it based on?
The Lighthouse perf score is calculated from a weighted, blended set of
performance metrics. You can see the current and previous Lighthouse score
compositions (which metrics we are blending together, and at what weights) in
the [score
calculator](https://googlechrome.github.io/lighthouse/scorecalc/#FCP=3000&SI=5800&FMP=4000&TTI=7300&FCI=6500&LCP=4000&TBT=600&CLS=0.25&device=mobile&version=8&version=6&version=5),
and learn more about the [calculation specifics
here](https://developer.chrome.com/docs/lighthouse/performance/performance-scoring/).
### What is the most exciting update in LH v8?
We're really excited about the [interactive
treemap](https://github.com/GoogleChrome/lighthouse/releases/tag/v7.5.0#:~:text=We%20are%20releasing%20the%20Lighthouse%20Treemap),
[filtering audits by
metric](https://github.com/GoogleChrome/lighthouse/releases/tag/v8.0.0#:~:text=The%20report%20includes%20a-,new%20metric%20filter,-.%20Pick%20a%20metric),
and the new [Content Security Policy
audit](https://web.dev/articles/strict-csp#adopting_a_strict_csp), which was a
collaboration with the Google Web Security team.
---
# Source: https://github.com/GoogleChrome/lighthouse/blob/main/docs/variability.md
# Score Variability
## Summary
Lighthouse performance scores will change due to inherent variability in web and network technologies, even if there hasn't been a code change. Run Lighthouse multiple times and beware of variability before drawing conclusions about a performance-impacting change.
## Sources of Variability
Variability in performance measurement is introduced via a number of channels with different levels of impact. Below is a table containing several common sources of metric variability, the typical impact they have on results, and the extent to which they are likely to occur in different environments.
| Source | Impact | Typical End User | PageSpeed Insights | Controlled Lab |
| --------------------------- | ------ | ---------------- | ------------------ | -------------- |
| Page nondeterminism | High | LIKELY | LIKELY | LIKELY |
| Local network variability | High | LIKELY | UNLIKELY | UNLIKELY |
| Tier-1 network variability | Medium | POSSIBLE | POSSIBLE | POSSIBLE |
| Web server variability | Low | LIKELY | LIKELY | LIKELY |
| Client hardware variability | High | LIKELY | UNLIKELY | UNLIKELY |
| Client resource contention | High | LIKELY | POSSIBLE | UNLIKELY |
| Browser nondeterminism | Medium | CERTAIN | CERTAIN | CERTAIN |
Below are more detailed descriptions of the sources of variance and the impact they have on the most likely combinations of Lighthouse runtime + environment. While DevTools throttling and simulated throttling approaches could be used in any of these three environments, the typical end user uses simulated throttling.
### Page Nondeterminism
Pages can contain logic that is nondeterministic that changes the way a user experiences a page, i.e. an A/B test that changes the layout and assets loaded or a different ad experience based on campaign progress. This is an intentional and irremovable source of variance. If the page changes in a way that hurts performance, Lighthouse should be able to identify this case. The only mitigation here is on the part of the site owner in ensuring that the exact same version of the page is being tested between different runs.
### Local Network Variability
Local networks have inherent variability from packet loss, variable traffic prioritization, and last-mile network congestion. Users with cheap routers and many devices sharing limited bandwidth are usually the most susceptible to this. _DevTools_ throttling partially mitigates these effects by applying a minimum request latency and maximum throughput that masks underlying retries. _Simulated_ throttling mitigates these effects by replaying network activity on its own.
### Tier-1 Network Variability
Network interconnects are generally very stable and have minimal impact but cross-geo requests, i.e. measuring performance of a Chinese site from the US, can start to experience a high degree of latency introduced from tier-1 network hops. _DevTools_ throttling partially masks these effects with network throttling. _Simulated_ throttling mitigates these effects by replaying network activity on its own.
### Web Server Variability
Web servers have variable load and do not always respond with the same delay. Lower-traffic sites with shared hosting infrastructure are typically more susceptible to this. _DevTools_ throttling partially masks these effects by applying a minimum request latency in its network throttling. _Simulated_ throttling is susceptible to this effect but the overall impact is usually low when compared to other network variability.
### Client Hardware Variability
The hardware on which the webpage is loading can greatly impact performance. _DevTools_ throttling cannot do much to mitigate this issue. _Simulated_ throttling partially mitigates this issue by capping the theoretical execution time of CPU tasks during simulation.
### Client Resource Contention
Other applications running on the same machine while Lighthouse is running can cause contention for CPU, memory, and network resources. Malware, browser extensions, and anti-virus software have particularly strong impacts on web performance. Multi-tenant server environments (such as Travis, AWS, etc) can also suffer from these issues. Running multiple instances of Lighthouse at once also typically distorts results due to this problem. _DevTools_ throttling is susceptible to this issue. _Simulated_ throttling partially mitigates this issue by replaying network activity on its own and capping CPU execution.
### Browser Nondeterminism
Browsers have inherent variability in their execution of tasks that impacts the way webpages are loaded. This is unavoidable for devtools throttling as at the end of the day they are simply reporting whatever was observed by the browser. _Simulated_ throttling is able to partially mitigate this effect by simulating execution on its own, only re-using task execution times from the browser in its estimate.
### Effect of Throttling Strategies
Below is a table containing several common sources of metric variability, the typical impact they have on results, and the extent to which different Lighthouse throttling strategies are able to mitigate their effect. Learn more about different throttling strategies in our [throttling documentation](./throttling.md).
| Source | Impact | Simulated Throttling | DevTools Throttling | No Throttling |
| --------------------------- | ------ | -------------------- | ------------------- | ------------- |
| Page nondeterminism | High | NO MITIGATION | NO MITIGATION | NO MITIGATION |
| Local network variability | High | MITIGATED | PARTIALLY MITIGATED | NO MITIGATION |
| Tier-1 network variability | Medium | MITIGATED | PARTIALLY MITIGATED | NO MITIGATION |
| Web server variability | Low | NO MITIGATION | PARTIALLY MITIGATED | NO MITIGATION |
| Client hardware variability | High | PARTIALLY MITIGATED | NO MITIGATION | NO MITIGATION |
| Client resource contention | High | PARTIALLY MITIGATED | NO MITIGATION | NO MITIGATION |
| Browser nondeterminism | Medium | PARTIALLY MITIGATED | NO MITIGATION | NO MITIGATION |
## Strategies for Dealing With Variance
### Run on Adequate Hardware
Loading modern webpages on a modern browser is not an easy task. Using appropriately powerful hardware can make a world of difference when it comes to variability.
- Minimum 2 dedicated cores (4 recommended)
- Minimum 2GB RAM (4-8GB recommended)
- Avoid non-standard Chromium flags (`--single-process` is not supported, `--no-sandbox` and `--headless` should be OK, though educate yourself about [sandbox tradeoffs](https://github.com/GoogleChrome/lighthouse-ci/tree/fbb540507c031100ee13bf7eb1a4b61c79c5e1e6/docs/recipes/docker-client#--no-sandbox-issues-explained))
- Avoid function-as-a-service infrastructure (Lambda, GCF, etc)
- Avoid "burstable" or "shared-core" instance types (AWS `t` instances, GCP shared-core N1 and E2 instances, etc)
AWS's `m5.large`, GCP's `n2-standard-2`, and Azure's `D2` all should be sufficient to run a single Lighthouse run at a time (~$0.10/hour for these instance types, ~30s/test, ~$0.0008/Lighthouse report). While some environments that don't meet the requirements above will still be able to run Lighthouse and the non-performance results will still be usable, we'd advise against it and won't be able to support those environments should any bugs arise. Remember, running on inconsistent hardware will lead to inconsistent results!
**DO NOT** collect multiple Lighthouse reports at the same time on the same machine. Concurrent runs can skew performance results due to resource contention. When it comes to Lighthouse runs, scaling horizontally is better than scaling vertically (i.e. run with 4 `n2-standard-2` instead of 1 `n2-standard-8`).
### Isolate External Factors
- Isolate your page from third-party influence as much as possible. It’s never fun to be blamed for someone else's variable failures.
- Isolate your own code’s nondeterminism during testing. If you’ve got an animation that randomly shows up, your performance numbers might be random too!
- Isolate your test server from as much network volatility as possible. Use localhost or a machine on the same exact network whenever stability is a concern.
- Isolate your client environment from external influences like anti-virus software and browser extensions. Use a dedicated device for testing when possible.
If your machine has really limited resources or creating a clean environment has been difficult, use a hosted lab environment like PageSpeed Insights or WebPageTest to run your tests for you. In continuous integration situations, use dedicated servers when possible. Free CI environments and “burstable” instances are typically quite volatile.
### Run Lighthouse Multiple Times
When creating your thresholds for failure, either mental or programmatic, use aggregate values like the median, 90th percentile, or even min/max instead of single test results.
The median Lighthouse score of 5 runs is twice as stable as 1 run. There are multiple ways to get a Lighthouse report, but the simplest way to run Lighthouse multiple times and also get a median run is to use [lighthouse-ci](https://github.com/GoogleChrome/lighthouse-ci/).
```bash
npx -p @lhci/cli lhci collect --url https://example.com -n 5
npx -p @lhci/cli lhci upload --target filesystem --outputDir ./path/to/dump/reports
```
> Note: you must have [Node](https://nodejs.org/en/download/package-manager/) installed.
You can then process the reports that are output to the filesystem. Read the [Lighthouse CI documentation](https://github.com/GoogleChrome/lighthouse-ci/blob/main/docs/configuration.md#outputdir) for more.
```js
const fs = require('fs');
const lhciManifest = require('./path/to/dump/reports/manifest.json');
const medianEntry = lhciManifest.find(entry => entry.isRepresentativeRun)
const medianResult = JSON.parse(fs.readFileSync(medianEntry.jsonPath, 'utf-8'));
console.log('Median performance score was', medianResult.categories.performance.score * 100);
```
You can also direct `lighthouse-ci` to use PageSpeedInsights:
```bash
npx -p @lhci/cli lhci collect --url https://example.com -n 5 --mode psi --psiApiKey xXxXxXx
npx -p @lhci/cli lhci upload --target filesystem --outputDir ./path/to/dump/reports
```
If you're running Lighthouse directly via node, you can use the `computeMedianRun` function to determine the median using a blend of the performance metrics.
```js
const spawnSync = require('child_process').spawnSync;
const lighthouseCli = require.resolve('lighthouse/cli');
const {computeMedianRun} = require('lighthouse/core/lib/median-run.js');
const results = [];
for (let i = 0; i < 5; i++) {
console.log(`Running Lighthouse attempt #${i + 1}...`);
const {status = -1, stdout} = spawnSync('node', [
lighthouseCli,
'https://example.com',
'--output=json'
]);
if (status !== 0) {
console.log('Lighthouse failed, skipping run...');
continue;
}
results.push(JSON.parse(stdout));
}
const median = computeMedianRun(results);
console.log('Median performance score was', median.categories.performance.score * 100);
```
## Related Documentation
- [Lighthouse Variability and Accuracy Analysis](https://docs.google.com/document/d/1BqtL-nG53rxWOI5RO0pItSRPowZVnYJ_gBEQCJ5EeUE/edit?usp=sharing)
- [Throttling documentation](./throttling.md)
- [Why is my Lighthouse score different from PageSpeed Insights?](https://www.debugbear.com/blog/why-is-my-lighthouse-score-different-from-pagespeed-insights)